| Red | Green | Blue | |
| z | 17.64 | ||
| znorm | Inf | ||
| sky | -Inf | -Inf | -Inf |
| S/N | 12.2 | 18.8 | 20.1 |
| S/N(c) | 0.0 | 0.0 | 0.0 |
| SN(E/C) |
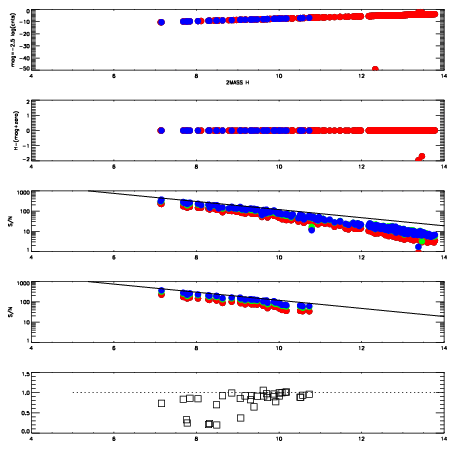
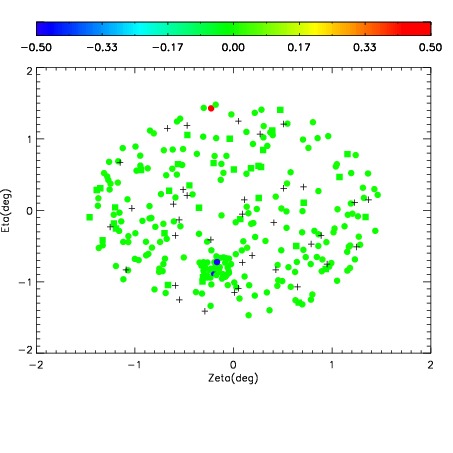
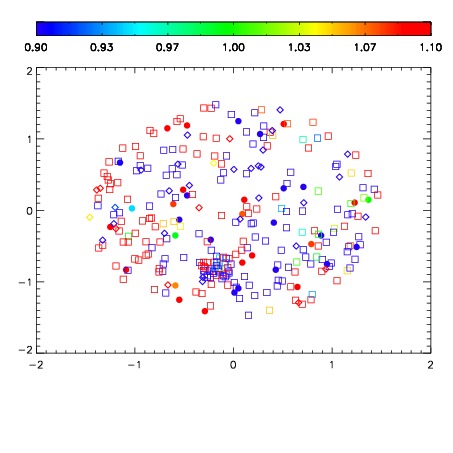
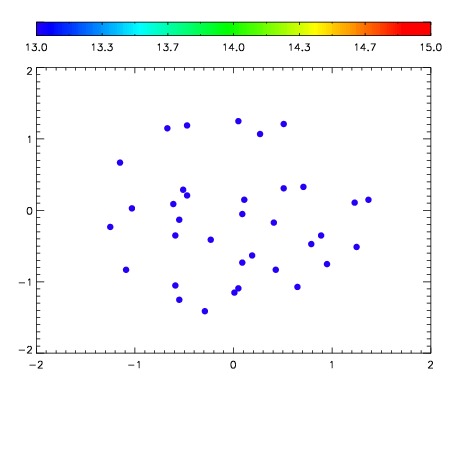

| Frame | Nreads | Zeropoints | Mag plots | Spatial mag deviation | Spatial sky 16325A emission deviations (filled: sky, open: star) | Spatial sky continuum emission | Spatial sky telluric CO2 absorption deviations (filled: H < 10) | |||||||||||||||||||||||
| 0 | 0 |
|
|
|
|
|
|
| IPAIR | NAME | SHIFT | NEWSHIFT | S/N | NAME | SHIFT | NEWSHIFT | S/N |
| 0 | 12350015 | 0.493411 | 0.00000 | 129.217 | 12350017 | 0.00315953 | 0.490251 | 90.4677 |
| 1 | 12350014 | 0.492542 | 0.000869006 | 171.916 | 12350013 | 0.00000 | 0.493411 | 187.118 |
| 2 | 12350018 | 0.492851 | 0.000560015 | 131.863 | 12350020 | 0.00417747 | 0.489234 | 100.884 |
| 3 | 12350019 | 0.493377 | 3.40044e-05 | 98.5138 | 12350016 | 0.00289963 | 0.490511 | 65.9144 |