| Red | Green | Blue | |
| z | 17.64 | ||
| znorm | Inf | ||
| sky | -Inf | -Inf | -Inf |
| S/N | 16.6 | 26.7 | 28.2 |
| S/N(c) | 0.0 | 0.0 | 0.0 |
| SN(E/C) |

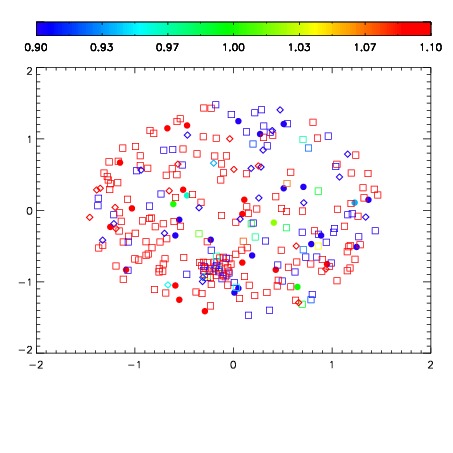
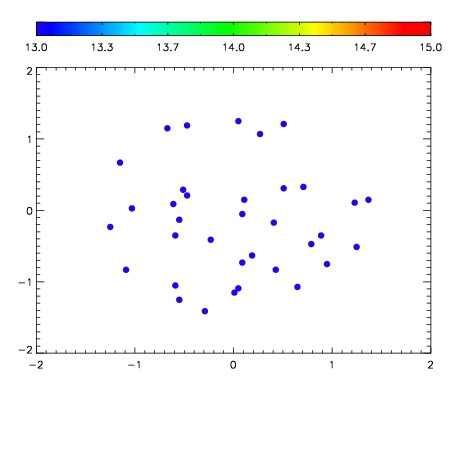

| Frame | Nreads | Zeropoints | Mag plots | Spatial mag deviation | Spatial sky 16325A emission deviations (filled: sky, open: star) | Spatial sky continuum emission | Spatial sky telluric CO2 absorption deviations (filled: H < 10) | |||||||||||||||||||||||
| 0 | 0 |
|
|
|
|
|
|
| IPAIR | NAME | SHIFT | NEWSHIFT | S/N | NAME | SHIFT | NEWSHIFT | S/N |
| 0 | 12430017 | 0.493818 | 0.00000 | 168.337 | 12430015 | 0.00180603 | 0.492012 | 162.063 |
| 1 | 12430016 | 0.493700 | 0.000118017 | 170.596 | 12430018 | 0.00313362 | 0.490684 | 178.258 |
| 2 | 12430013 | 0.492346 | 0.00147203 | 142.653 | 12430014 | 0.000454715 | 0.493363 | 155.212 |
| 3 | 12430012 | 0.492045 | 0.00177303 | 133.196 | 12430011 | 0.00000 | 0.493818 | 123.186 |