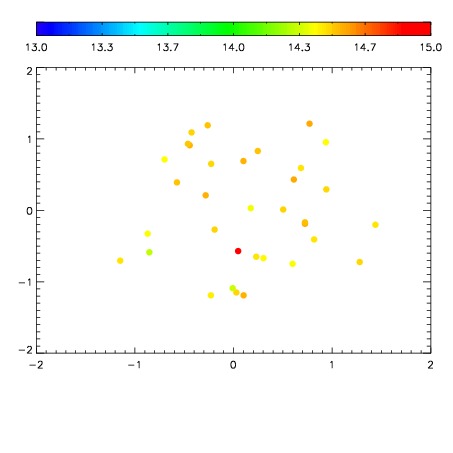
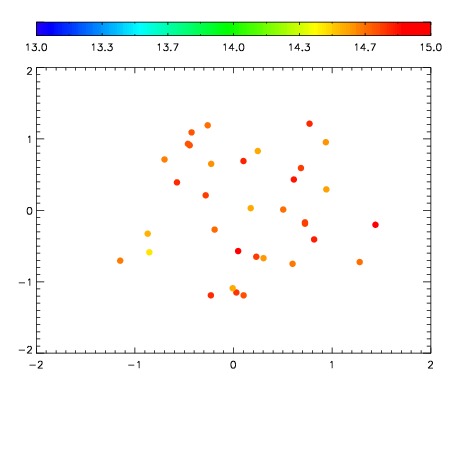
| Frame | Nreads | Zeropoints | Mag plots
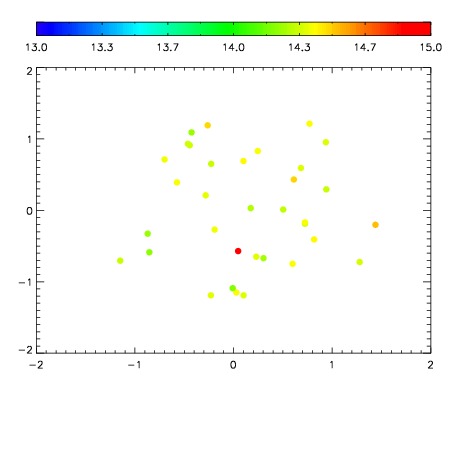
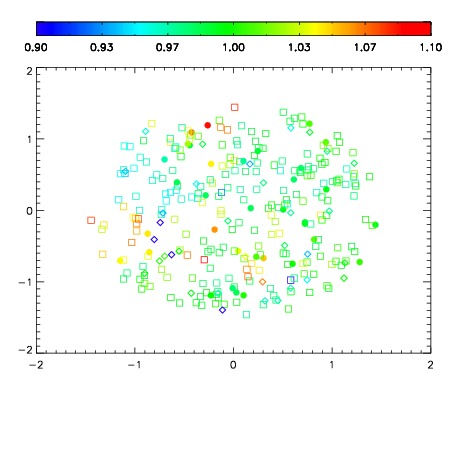
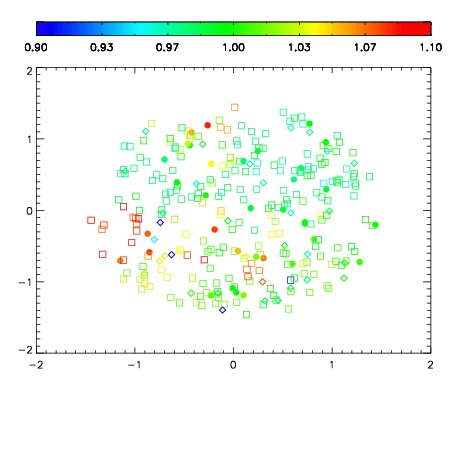
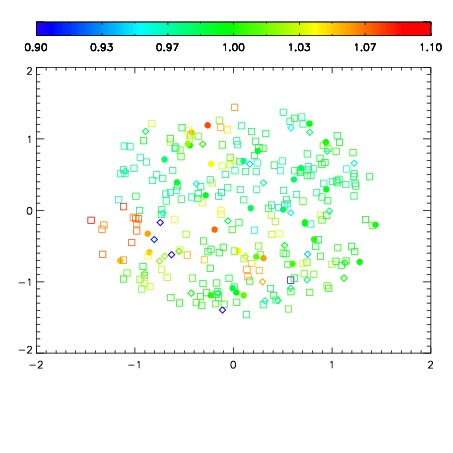
| Spatial mag deviation
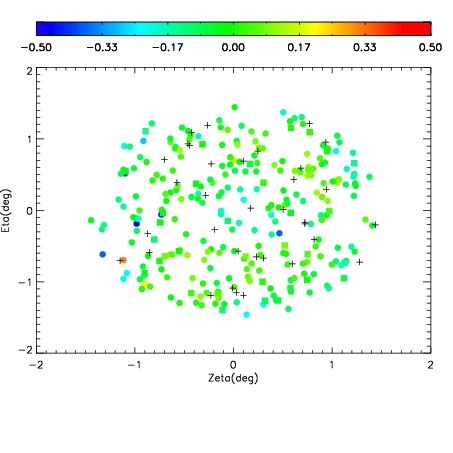
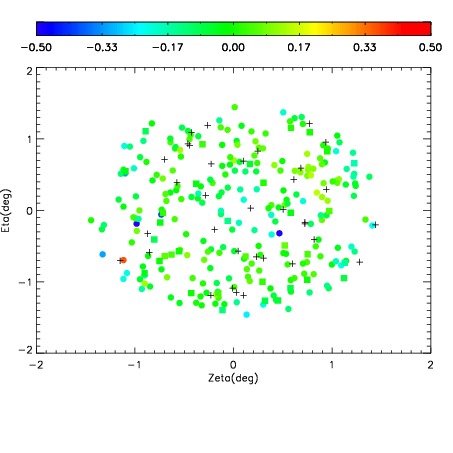
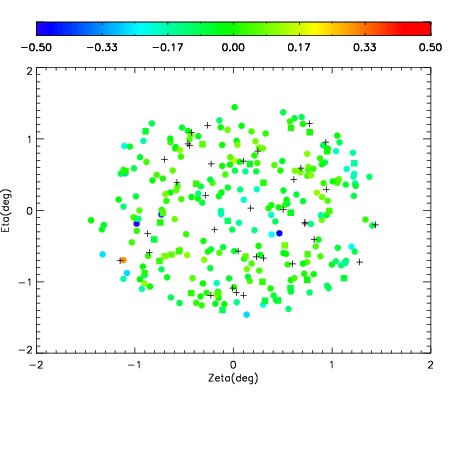
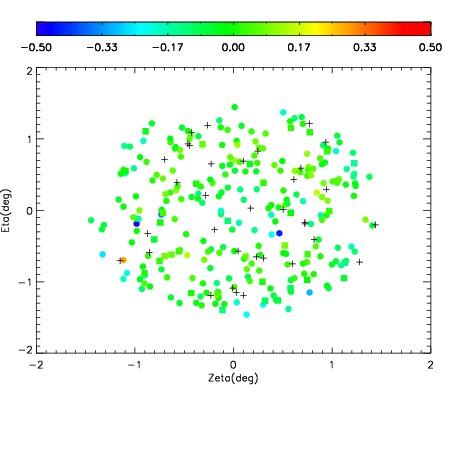
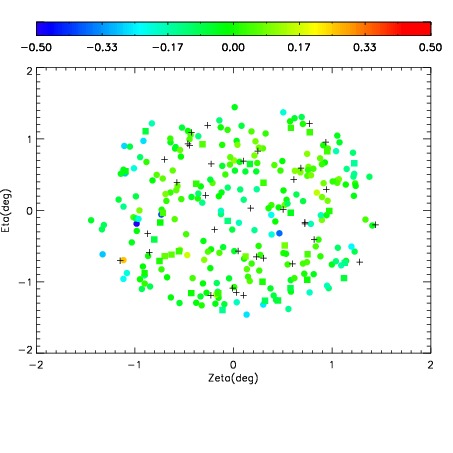
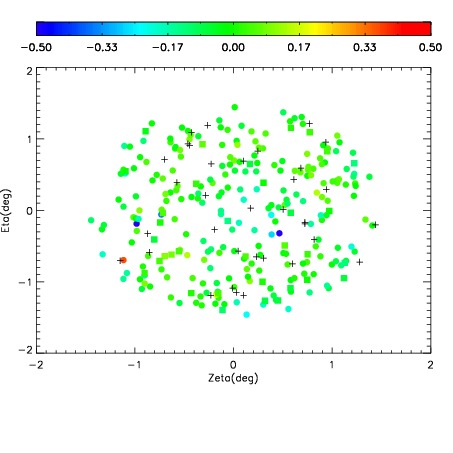
| Spatial sky 16325A emission deviations (filled: sky, open: star)
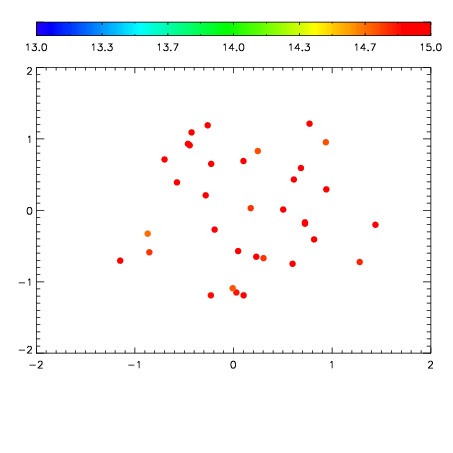
| Spatial sky continuum emission
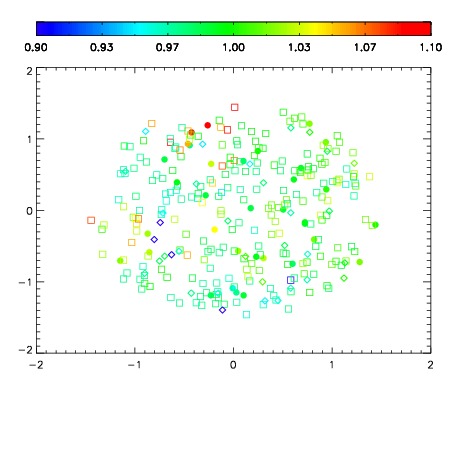
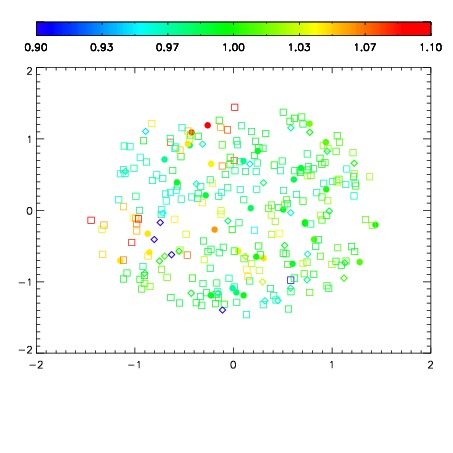
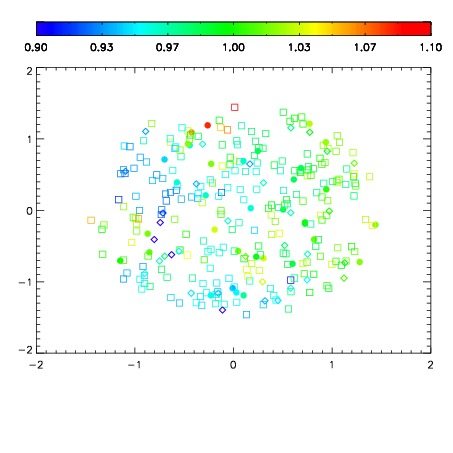
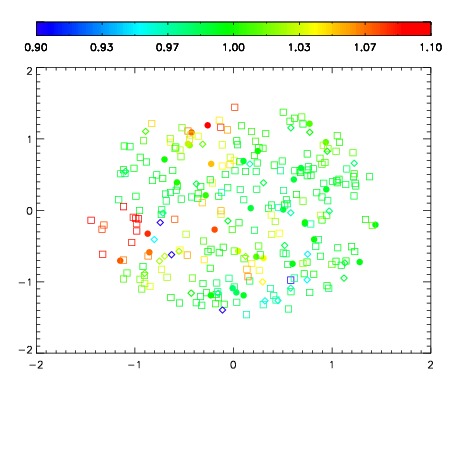
| Spatial sky telluric CO2 absorption deviations (filled: H < 10)
|
| 12290046
| 47
| | Red | Green | Blue
| | z | | 18.28
| | znorm | | 14.10
| | sky | 14.8 | 14.4 | 14.2
| | S/N | 9.4 | 16.8 | 16.2
| | S/N(c) | 8.1 | 15.1 | 15.4
| | SN(E/C) 1.04
|
| 
| 
| 
| 
| 
|
| 12290047
| 47
| | Red | Green | Blue
| | z | | 18.24
| | znorm | | 14.06
| | sky | 14.8 | 14.5 | 14.7
| | S/N | 8.8 | 16.1 | 16.3
| | S/N(c) | 7.4 | 14.6 | 15.2
| | SN(E/C) 0.96
|
| 
| 
| 
| 
| 
|
| 12290048
| 47
| | Red | Green | Blue
| | z | | 18.15
| | znorm | | 13.97
| | sky | 14.9 | 14.7 | 14.9
| | S/N | 8.1 | 15.2 | 15.3
| | S/N(c) | 7.1 | 13.7 | 14.2
| | SN(E/C) 1.03
|
| 
| 
| 
| 
| 
|
| 12290049
| 47
| | Red | Green | Blue
| | z | | 18.14
| | znorm | | 13.96
| | sky | 15.0 | 14.7 | 14.9
| | S/N | 8.0 | 15.2 | 15.3
| | S/N(c) | 7.0 | 13.7 | 14.3
| | SN(E/C) 0.98
|
| 
| 
| 
| 
| 
|
| 12290050
| 47
| | Red | Green | Blue
| | z | | 18.22
| | znorm | | 14.04
| | sky | 15.0 | 14.9 | 15.2
| | S/N | 8.4 | 15.8 | 16.1
| | S/N(c) | 7.2 | 14.4 | 15.1
| | SN(E/C) 0.99
|
| 
| 
| 
| 
| 
|
| 12290051
| 47
| | Red | Green | Blue
| | z | | 18.13
| | znorm | | 13.95
| | sky | 15.5 | 15.1 | 15.3
| | S/N | 7.7 | 14.8 | 15.0
| | S/N(c) | 6.7 | 13.5 | 13.8
| | SN(E/C) 0.98
|
| 
| 
| 
| 
| 
|
| 12290052
| 47
| | Red | Green | Blue
| | z | | 18.29
| | znorm | | 14.11
| | sky | 15.1 | 15.0 | 15.0
| | S/N | 8.9 | 16.3 | 16.5
| | S/N(c) | 7.7 | 14.8 | 15.5
| | SN(E/C) 1.01
|
| 
| 
| 
| 
| 
|
| 12290053
| 47
| | Red | Green | Blue
| | z | | 18.01
| | znorm | | 13.82
| | sky | 14.9 | 14.8 | 15.1
| | S/N | 7.1 | 13.6 | 13.5
| | S/N(c) | 6.2 | 12.0 | 12.8
| | SN(E/C) 1.01
|
| 
| 
| 
| 
| 
|