| Red | Green | Blue | |
| z | 17.64 | ||
| znorm | Inf | ||
| sky | -Inf | -Inf | -Inf |
| S/N | 7.7 | 17.2 | 19.7 |
| S/N(c) | 0.0 | 0.0 | 0.0 |
| SN(E/C) |
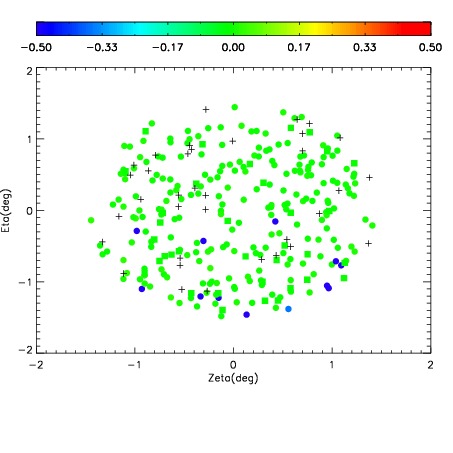
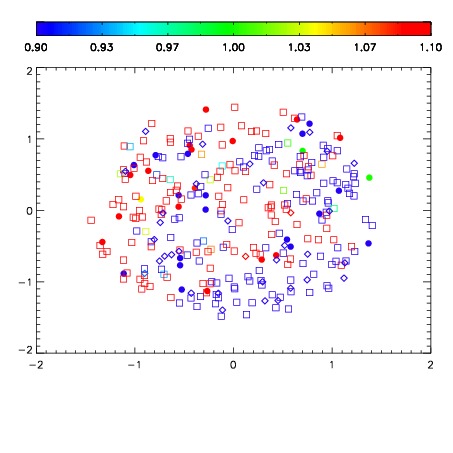
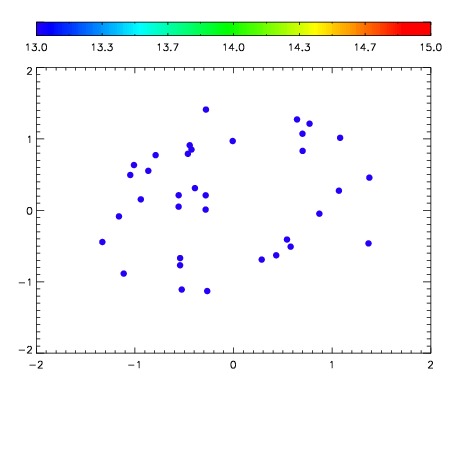

| Frame | Nreads | Zeropoints | Mag plots | Spatial mag deviation | Spatial sky 16325A emission deviations (filled: sky, open: star) | Spatial sky continuum emission | Spatial sky telluric CO2 absorption deviations (filled: H < 10) | |||||||||||||||||||||||
| 0 | 0 |
|
|
|
|
|
|
| IPAIR | NAME | SHIFT | NEWSHIFT | S/N | NAME | SHIFT | NEWSHIFT | S/N |
| 0 | 12260061 | 0.488580 | 0.00000 | 86.3624 | 12260062 | -0.00281980 | 0.491400 | 89.5734 |
| 1 | 12260064 | 0.485712 | 0.00286800 | 89.8643 | 12260059 | 0.00000 | 0.488580 | 91.4616 |
| 2 | 12260060 | 0.488444 | 0.000135988 | 83.7578 | 12260066 | -0.00439036 | 0.492970 | 87.4848 |
| 3 | 12260065 | 0.486405 | 0.00217500 | 82.5805 | 12260063 | -0.00232679 | 0.490907 | 85.4893 |