| Red | Green | Blue | |
| z | 17.64 | ||
| znorm | Inf | ||
| sky | -Inf | -Inf | -Inf |
| S/N | 23.3 | 40.8 | 42.3 |
| S/N(c) | 0.0 | 0.0 | 0.0 |
| SN(E/C) |
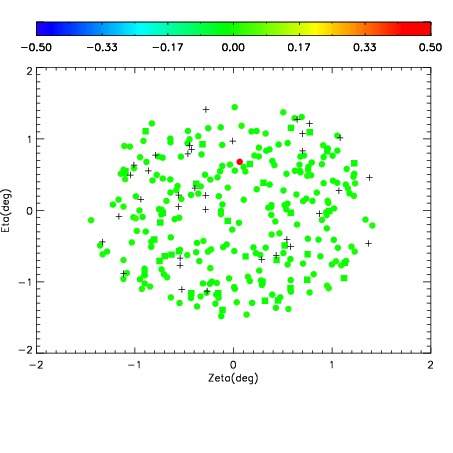
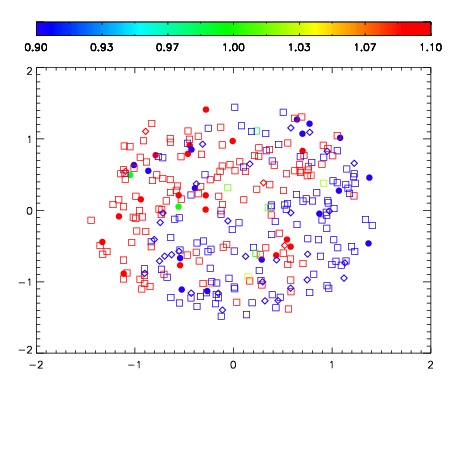
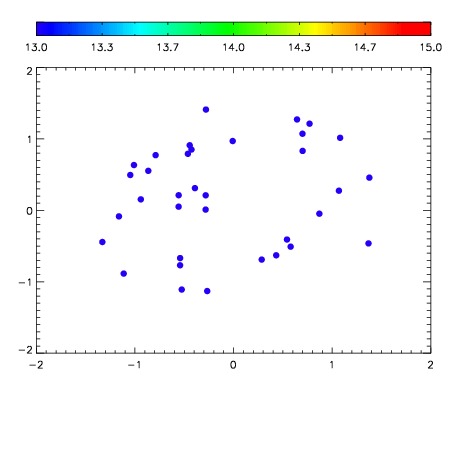

| Frame | Nreads | Zeropoints | Mag plots | Spatial mag deviation | Spatial sky 16325A emission deviations (filled: sky, open: star) | Spatial sky continuum emission | Spatial sky telluric CO2 absorption deviations (filled: H < 10) | |||||||||||||||||||||||
| 0 | 0 |
|
|
|
|
|
|
| IPAIR | NAME | SHIFT | NEWSHIFT | S/N | NAME | SHIFT | NEWSHIFT | S/N |
| 0 | 12340022 | 0.493516 | 0.00000 | 187.766 | 12340023 | -0.00267968 | 0.496196 | 189.082 |
| 1 | 12340025 | 0.492982 | 0.000533998 | 220.486 | 12340027 | -0.00208245 | 0.495598 | 212.674 |
| 2 | 12340021 | 0.493126 | 0.000389993 | 218.177 | 12340020 | 0.00000 | 0.493516 | 210.955 |
| 3 | 12340026 | 0.493355 | 0.000160992 | 218.173 | 12340024 | -0.00294099 | 0.496457 | 209.626 |