| Red | Green | Blue | |
| z | 17.64 | ||
| znorm | Inf | ||
| sky | -NaN | -Inf | -Inf |
| S/N | 35.1 | 51.9 | 57.7 |
| S/N(c) | 0.0 | 0.0 | 0.0 |
| SN(E/C) |


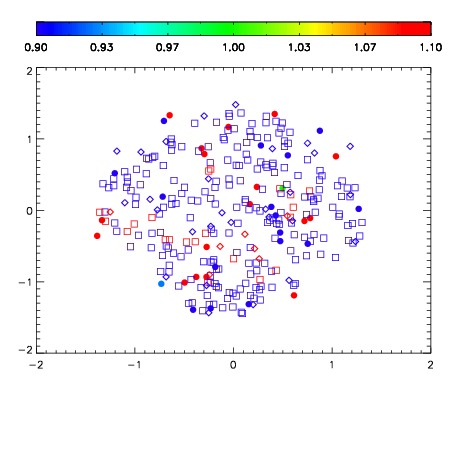


| Frame | Nreads | Zeropoints | Mag plots | Spatial mag deviation | Spatial sky 16325A emission deviations (filled: sky, open: star) | Spatial sky continuum emission | Spatial sky telluric CO2 absorption deviations (filled: H < 10) | |||||||||||||||||||||||
| 0 | 0 |
|
|
|
|
|
|
| IPAIR | NAME | SHIFT | NEWSHIFT | S/N | NAME | SHIFT | NEWSHIFT | S/N |
| 0 | 08770053 | 0.468715 | 0.00000 | 215.194 | 08770054 | 0.00352328 | 0.465192 | 214.845 |
| 1 | 08770052 | 0.466877 | 0.00183800 | 214.448 | 08770050 | 0.00163009 | 0.467085 | 214.512 |
| 2 | 08770049 | 0.467980 | 0.000735015 | 211.470 | 08770051 | 0.00149413 | 0.467221 | 210.804 |
| 3 | 08770048 | 0.467313 | 0.00140202 | 204.517 | 08770047 | 0.00000 | 0.468715 | 200.989 |