| Red | Green | Blue | |
| z | 17.64 | ||
| znorm | Inf | ||
| sky | -Inf | -Inf | -Inf |
| S/N | 23.9 | 40.9 | 45.6 |
| S/N(c) | 0.0 | 0.0 | 0.0 |
| SN(E/C) |
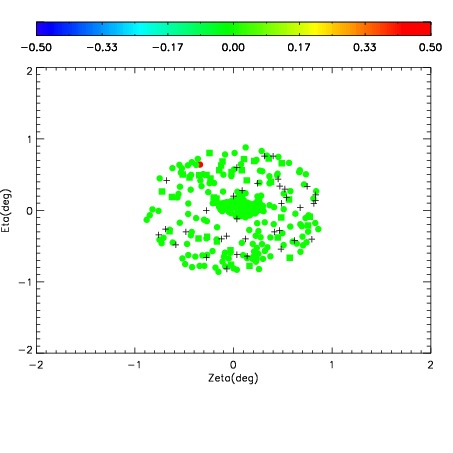
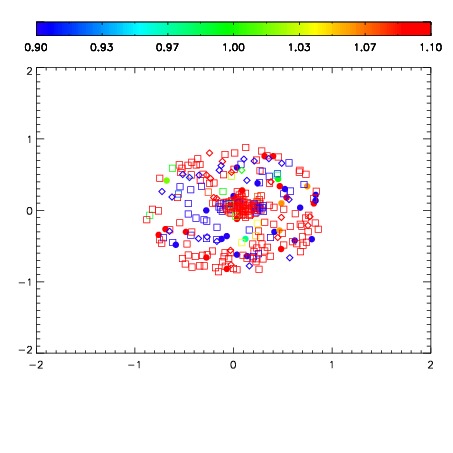
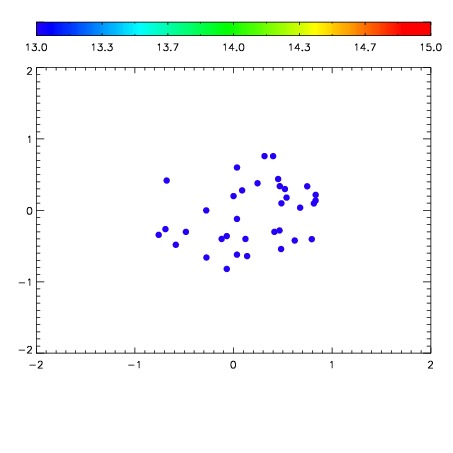

| Frame | Nreads | Zeropoints | Mag plots | Spatial mag deviation | Spatial sky 16325A emission deviations (filled: sky, open: star) | Spatial sky continuum emission | Spatial sky telluric CO2 absorption deviations (filled: H < 10) | |||||||||||||||||||||||
| 0 | 0 |
|
|
|
|
|
|
| IPAIR | NAME | SHIFT | NEWSHIFT | S/N | NAME | SHIFT | NEWSHIFT | S/N |
| 0 | 08510057 | 0.490225 | 0.00000 | 130.622 | 08510051 | 0.00000 | 0.490225 | 132.837 |
| 1 | 08510056 | 0.488189 | 0.00203598 | 136.854 | 08510054 | 0.000319381 | 0.489906 | 135.716 |
| 2 | 08510052 | 0.488359 | 0.00186598 | 129.963 | 08510055 | 0.000517727 | 0.489707 | 131.500 |
| 3 | 08510053 | 0.488781 | 0.00144398 | 126.259 | 08510058 | 0.00160910 | 0.488616 | 121.541 |
| 4 | 08510060 | 0.488712 | 0.00151297 | 117.117 | 08510059 | -0.000365963 | 0.490591 | 118.454 |