| Red | Green | Blue | |
| z | 17.64 | ||
| znorm | Inf | ||
| sky | -Inf | -Inf | -Inf |
| S/N | 35.4 | 52.6 | 59.5 |
| S/N(c) | 0.0 | 0.0 | 0.0 |
| SN(E/C) |

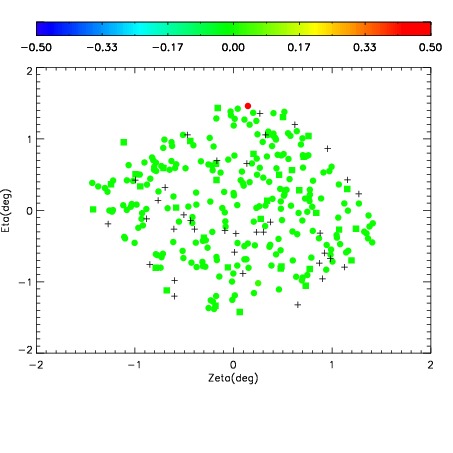
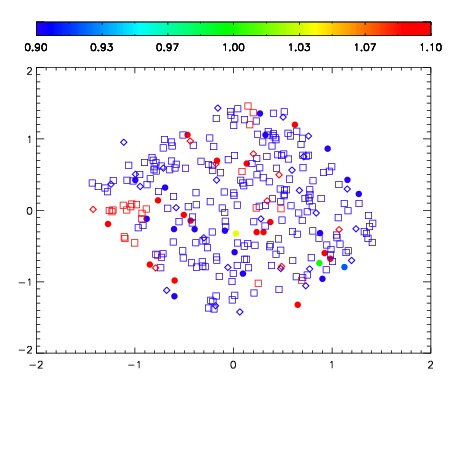
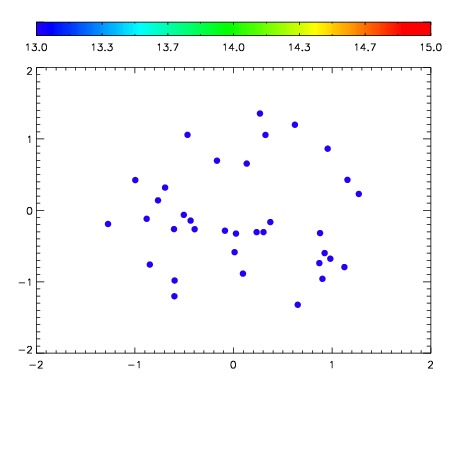

| Frame | Nreads | Zeropoints | Mag plots | Spatial mag deviation | Spatial sky 16325A emission deviations (filled: sky, open: star) | Spatial sky continuum emission | Spatial sky telluric CO2 absorption deviations (filled: H < 10) | |||||||||||||||||||||||
| 0 | 0 |
|
|
|
|
|
|
| IPAIR | NAME | SHIFT | NEWSHIFT | S/N | NAME | SHIFT | NEWSHIFT | S/N |
| 0 | 08770063 | 0.472250 | 0.00000 | 198.568 | 08770061 | 0.000522061 | 0.471728 | 203.937 |
| 1 | 08770059 | 0.472117 | 0.000133008 | 207.811 | 08770062 | 0.000127476 | 0.472123 | 209.631 |
| 2 | 08770060 | 0.472207 | 4.30048e-05 | 204.943 | 08770058 | 0.00000 | 0.472250 | 208.898 |
| 3 | 08770064 | 0.471076 | 0.00117400 | 200.773 | 08770065 | 0.000829009 | 0.471421 | 208.818 |