| Red | Green | Blue | |
| z | 17.64 | ||
| znorm | Inf | ||
| sky | -Inf | -Inf | -Inf |
| S/N | 22.1 | 39.1 | 41.6 |
| S/N(c) | 0.0 | 0.0 | 0.0 |
| SN(E/C) |

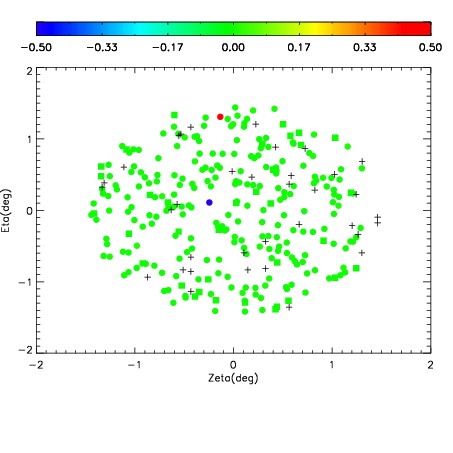
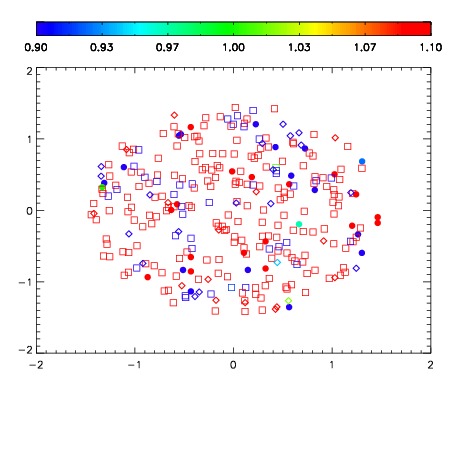


| Frame | Nreads | Zeropoints | Mag plots | Spatial mag deviation | Spatial sky 16325A emission deviations (filled: sky, open: star) | Spatial sky continuum emission | Spatial sky telluric CO2 absorption deviations (filled: H < 10) | |||||||||||||||||||||||
| 0 | 0 |
|
|
|
|
|
|
| IPAIR | NAME | SHIFT | NEWSHIFT | S/N | NAME | SHIFT | NEWSHIFT | S/N |
| 0 | 12550054 | 0.495246 | 0.00000 | 198.653 | 12550052 | 0.00129305 | 0.493953 | 194.769 |
| 1 | 12550053 | 0.494235 | 0.00101098 | 198.699 | 12550055 | 0.00115228 | 0.494094 | 195.659 |
| 2 | 12550050 | 0.493627 | 0.00161898 | 181.890 | 12550051 | 0.000337298 | 0.494909 | 183.857 |
| 3 | 12550049 | 0.492543 | 0.00270298 | 176.208 | 12550048 | 0.00000 | 0.495246 | 172.044 |