| Red | Green | Blue | |
| z | 17.64 | ||
| znorm | Inf | ||
| sky | -NaN | -Inf | -Inf |
| S/N | 18.8 | 33.1 | 35.0 |
| S/N(c) | 0.0 | 0.0 | 0.0 |
| SN(E/C) |
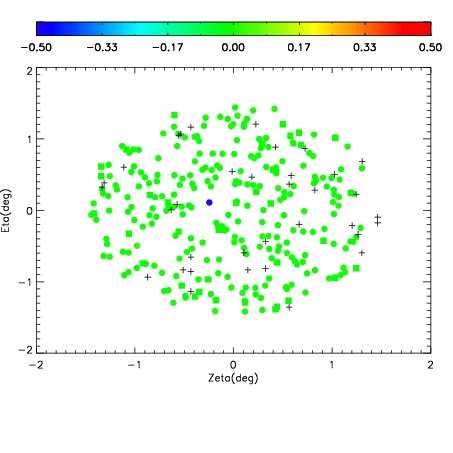
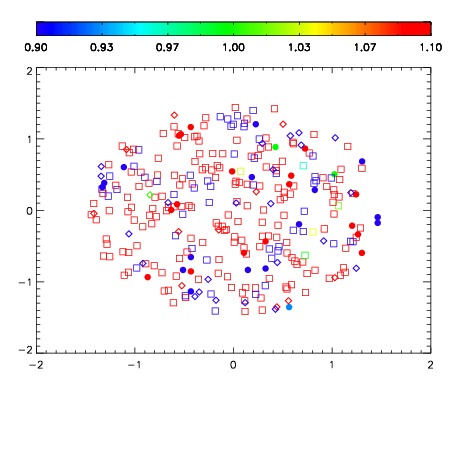


| Frame | Nreads | Zeropoints | Mag plots | Spatial mag deviation | Spatial sky 16325A emission deviations (filled: sky, open: star) | Spatial sky continuum emission | Spatial sky telluric CO2 absorption deviations (filled: H < 10) | |||||||||||||||||||||||
| 0 | 0 |
|
|
|
|
|
|
| IPAIR | NAME | SHIFT | NEWSHIFT | S/N | NAME | SHIFT | NEWSHIFT | S/N |
| 0 | 12590040 | 0.489456 | 0.00000 | 178.336 | 12590039 | 0.00000 | 0.489456 | 173.509 |
| 1 | 12590041 | 0.489201 | 0.000254989 | 163.043 | 12590043 | -0.00138302 | 0.490839 | 167.991 |
| 2 | 12590044 | 0.484192 | 0.00526398 | 157.076 | 12590042 | -0.000624279 | 0.490080 | 155.633 |
| 3 | 12590045 | 0.484783 | 0.00467300 | 155.673 | 12590046 | -0.00476521 | 0.494221 | 144.750 |