| Red | Green | Blue | |
| z | 17.64 | ||
| znorm | Inf | ||
| sky | -Inf | -Inf | -Inf |
| S/N | 20.8 | 37.5 | 39.8 |
| S/N(c) | 0.0 | 0.0 | 0.0 |
| SN(E/C) |
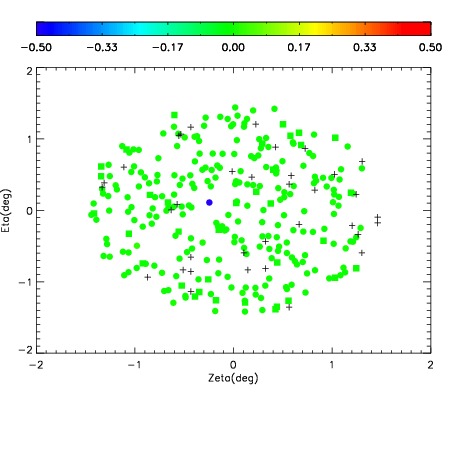
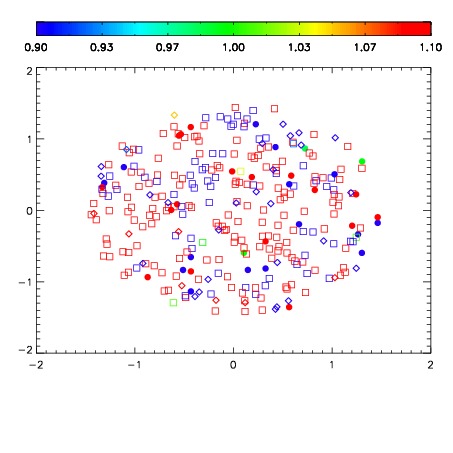
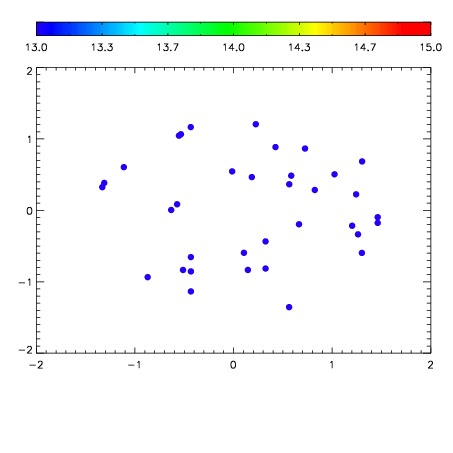

| Frame | Nreads | Zeropoints | Mag plots | Spatial mag deviation | Spatial sky 16325A emission deviations (filled: sky, open: star) | Spatial sky continuum emission | Spatial sky telluric CO2 absorption deviations (filled: H < 10) | |||||||||||||||||||||||
| 0 | 0 |
|
|
|
|
|
|
| IPAIR | NAME | SHIFT | NEWSHIFT | S/N | NAME | SHIFT | NEWSHIFT | S/N |
| 0 | 12630049 | 0.482526 | 0.00000 | 165.040 | 12630048 | -0.00230039 | 0.484826 | 170.242 |
| 1 | 12630046 | 0.481589 | 0.000937015 | 179.321 | 12630044 | 0.00000 | 0.482526 | 179.145 |
| 2 | 12630045 | 0.481541 | 0.000984997 | 177.196 | 12630047 | -0.00127760 | 0.483804 | 179.094 |
| 3 | 12630050 | 0.482442 | 8.40127e-05 | 150.977 | 12630051 | -0.000699811 | 0.483226 | 101.852 |