| Red | Green | Blue | |
| z | 17.64 | ||
| znorm | Inf | ||
| sky | -NaN | -Inf | -Inf |
| S/N | 36.5 | 60.3 | 62.7 |
| S/N(c) | 0.0 | 0.0 | 0.0 |
| SN(E/C) |
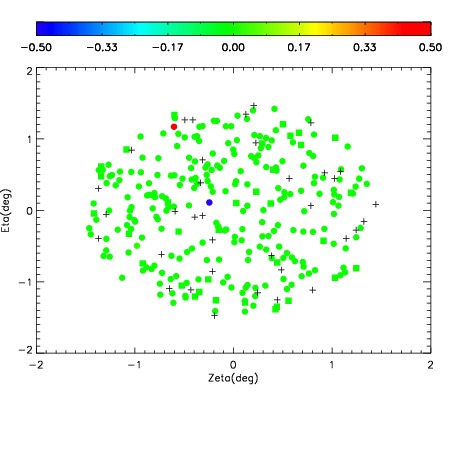
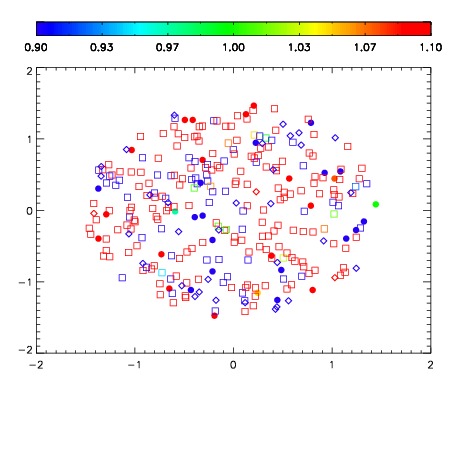
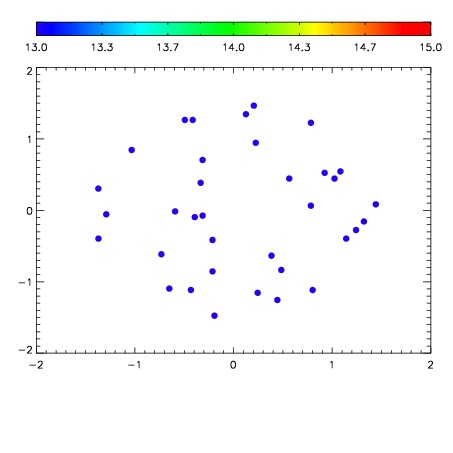

| Frame | Nreads | Zeropoints | Mag plots | Spatial mag deviation | Spatial sky 16325A emission deviations (filled: sky, open: star) | Spatial sky continuum emission | Spatial sky telluric CO2 absorption deviations (filled: H < 10) | |||||||||||||||||||||||
| 0 | 0 |
|
|
|
|
|
|
| IPAIR | NAME | SHIFT | NEWSHIFT | S/N | NAME | SHIFT | NEWSHIFT | S/N |
| 0 | 12520076 | 0.493213 | 0.00000 | 206.091 | 12520070 | 0.00000 | 0.493213 | 209.040 |
| 1 | 12520079 | 0.490040 | 0.00317299 | 211.802 | 12520077 | 0.000257876 | 0.492955 | 212.640 |
| 2 | 12520075 | 0.491527 | 0.00168601 | 208.881 | 12520078 | -0.000325844 | 0.493539 | 210.593 |
| 3 | 12520071 | 0.488866 | 0.00434700 | 205.943 | 12520074 | -0.000139011 | 0.493352 | 208.098 |
| 4 | 12520072 | 0.489831 | 0.00338200 | 203.923 | 12520073 | 2.95984e-05 | 0.493183 | 202.752 |