| Red | Green | Blue | |
| z | 17.64 | ||
| znorm | Inf | ||
| sky | -Inf | -Inf | -Inf |
| S/N | 28.0 | 49.4 | 50.3 |
| S/N(c) | 0.0 | 0.0 | 0.0 |
| SN(E/C) |

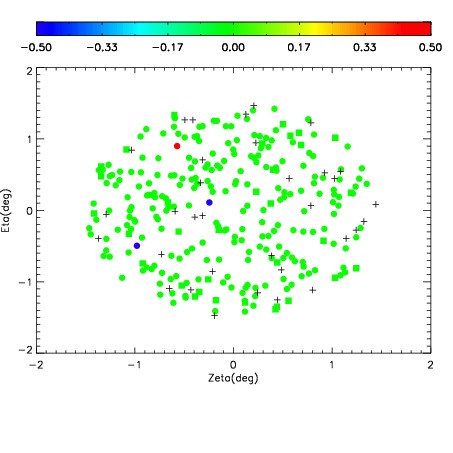
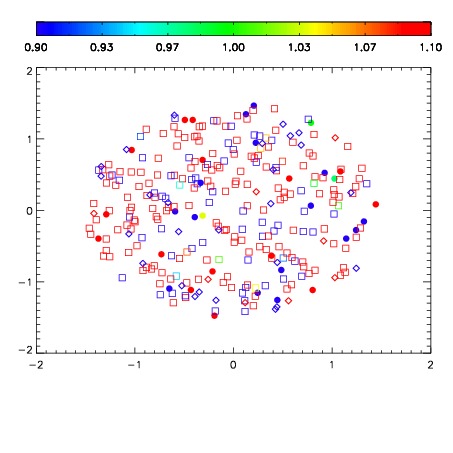


| Frame | Nreads | Zeropoints | Mag plots | Spatial mag deviation | Spatial sky 16325A emission deviations (filled: sky, open: star) | Spatial sky continuum emission | Spatial sky telluric CO2 absorption deviations (filled: H < 10) | |||||||||||||||||||||||
| 0 | 0 |
|
|
|
|
|
|
| IPAIR | NAME | SHIFT | NEWSHIFT | S/N | NAME | SHIFT | NEWSHIFT | S/N |
| 0 | 12560054 | 0.488676 | 0.00000 | 236.815 | 12560055 | 0.00287944 | 0.485797 | 234.177 |
| 1 | 12560053 | 0.488505 | 0.000171006 | 238.032 | 12560052 | 0.000168496 | 0.488508 | 234.437 |
| 2 | 12560049 | 0.485249 | 0.00342700 | 219.866 | 12560051 | -0.000600127 | 0.489276 | 224.340 |
| 3 | 12560050 | 0.485860 | 0.00281602 | 219.403 | 12560048 | 0.00000 | 0.488676 | 220.356 |