| Red | Green | Blue | |
| z | 17.64 | ||
| znorm | Inf | ||
| sky | -Inf | -NaN | -Inf |
| S/N | 31.2 | 50.0 | 52.9 |
| S/N(c) | 0.0 | 0.0 | 0.0 |
| SN(E/C) |
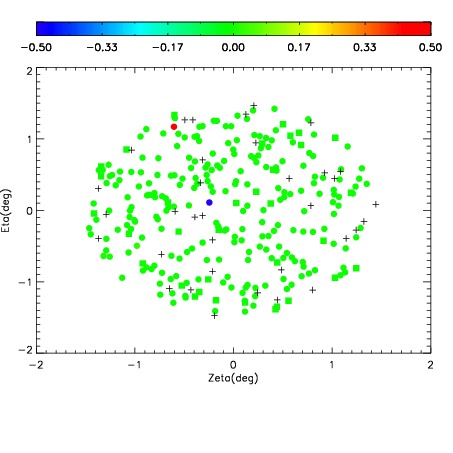
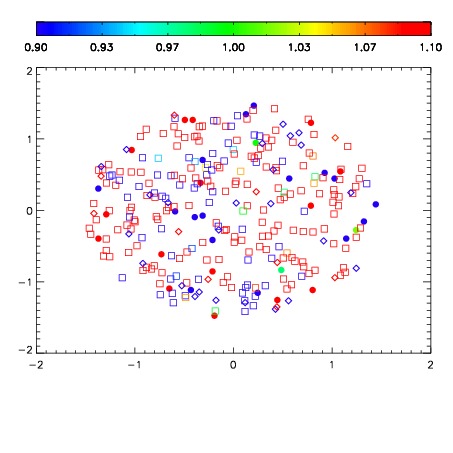
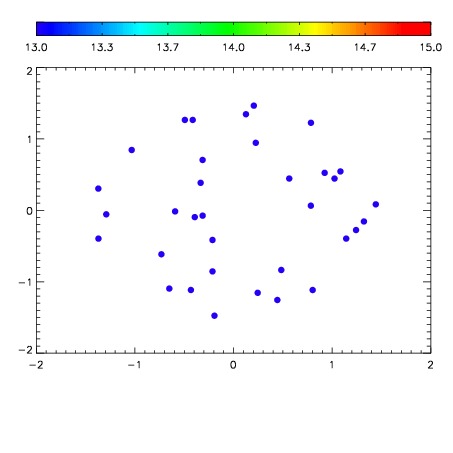

| Frame | Nreads | Zeropoints | Mag plots | Spatial mag deviation | Spatial sky 16325A emission deviations (filled: sky, open: star) | Spatial sky continuum emission | Spatial sky telluric CO2 absorption deviations (filled: H < 10) | |||||||||||||||||||||||
| 0 | 0 |
|
|
|
|
|
|
| IPAIR | NAME | SHIFT | NEWSHIFT | S/N | NAME | SHIFT | NEWSHIFT | S/N |
| 0 | 12620050 | 0.484423 | 0.00000 | 220.377 | 12620048 | -0.000687766 | 0.485111 | 217.869 |
| 1 | 12620049 | 0.484177 | 0.000246018 | 224.306 | 12620051 | -0.00200024 | 0.486423 | 222.896 |
| 2 | 12620046 | 0.483175 | 0.00124800 | 222.278 | 12620047 | -0.000420064 | 0.484843 | 221.031 |
| 3 | 12620045 | 0.482912 | 0.00151101 | 216.249 | 12620044 | 0.00000 | 0.484423 | 214.544 |