| Red | Green | Blue | |
| z | 17.64 | ||
| znorm | Inf | ||
| sky | -Inf | -Inf | -Inf |
| S/N | 27.3 | 44.2 | 54.5 |
| S/N(c) | 0.0 | 0.0 | 0.0 |
| SN(E/C) |


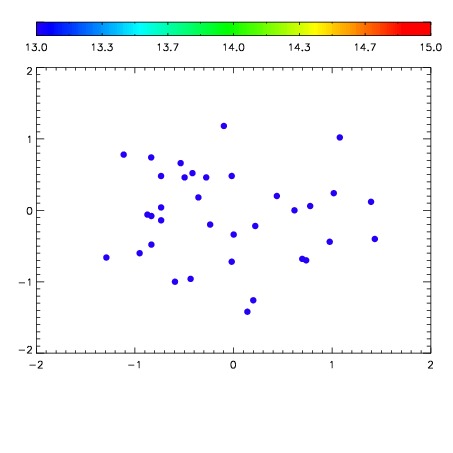

| Frame | Nreads | Zeropoints | Mag plots | Spatial mag deviation | Spatial sky 16325A emission deviations (filled: sky, open: star) | Spatial sky continuum emission | Spatial sky telluric CO2 absorption deviations (filled: H < 10) | |||||||||||||||||||||||
| 0 | 0 |
|
|
|
|
|
|
| IPAIR | NAME | SHIFT | NEWSHIFT | S/N | NAME | SHIFT | NEWSHIFT | S/N |
| 0 | 12560065 | 0.483830 | 0.00000 | 265.765 | 12560063 | -0.00152580 | 0.485356 | 265.862 |
| 1 | 12560061 | 0.482002 | 0.00182801 | 268.373 | 12560066 | 0.000232354 | 0.483598 | 270.296 |
| 2 | 12560060 | 0.482710 | 0.00112000 | 266.287 | 12560062 | -0.00187136 | 0.485701 | 269.613 |
| 3 | 12560064 | 0.482296 | 0.00153401 | 260.289 | 12560059 | 0.00000 | 0.483830 | 256.325 |