| Red | Green | Blue | |
| z | 17.64 | ||
| znorm | Inf | ||
| sky | -Inf | -Inf | -Inf |
| S/N | 26.6 | 43.6 | 50.0 |
| S/N(c) | 0.0 | 0.0 | 0.0 |
| SN(E/C) |
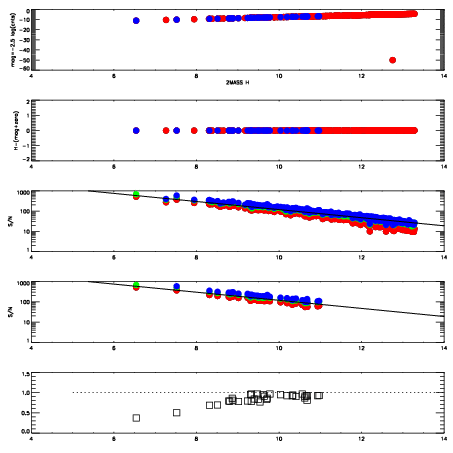
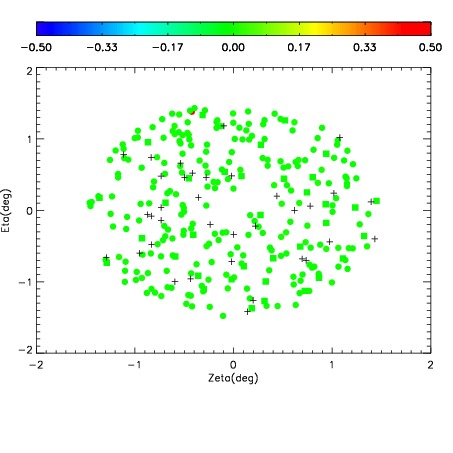
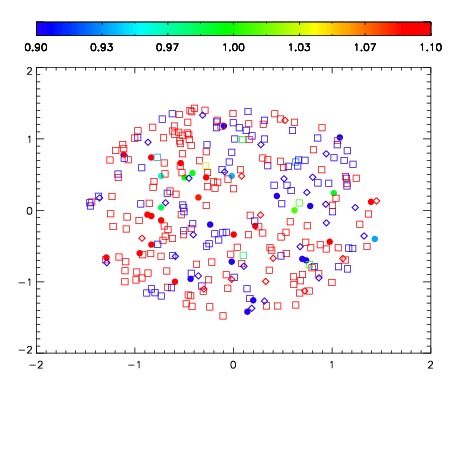


| Frame | Nreads | Zeropoints | Mag plots | Spatial mag deviation | Spatial sky 16325A emission deviations (filled: sky, open: star) | Spatial sky continuum emission | Spatial sky telluric CO2 absorption deviations (filled: H < 10) | |||||||||||||||||||||||
| 0 | 0 |
|
|
|
|
|
|
| IPAIR | NAME | SHIFT | NEWSHIFT | S/N | NAME | SHIFT | NEWSHIFT | S/N |
| 0 | 12620061 | 0.485387 | 0.00000 | 260.202 | 12620058 | -0.00156307 | 0.486950 | 256.240 |
| 1 | 12620060 | 0.484254 | 0.00113299 | 264.234 | 12620055 | 0.00000 | 0.485387 | 262.661 |
| 2 | 12620057 | 0.483461 | 0.00192600 | 260.706 | 12620062 | 0.000720314 | 0.484667 | 256.975 |
| 3 | 12620056 | 0.482685 | 0.00270200 | 257.677 | 12620059 | -0.00136003 | 0.486747 | 253.449 |