| Red | Green | Blue | |
| z | 17.64 | ||
| znorm | Inf | ||
| sky | -Inf | -Inf | -Inf |
| S/N | 27.8 | 46.8 | 51.6 |
| S/N(c) | 0.0 | 0.0 | 0.0 |
| SN(E/C) |
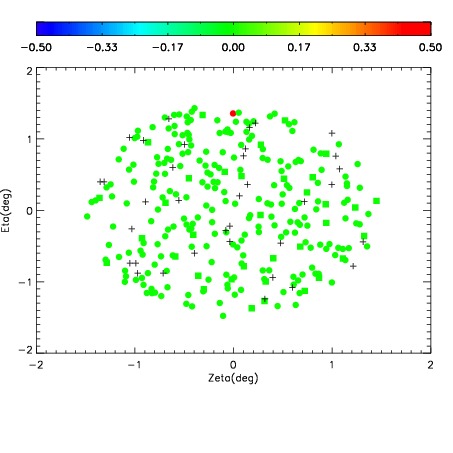
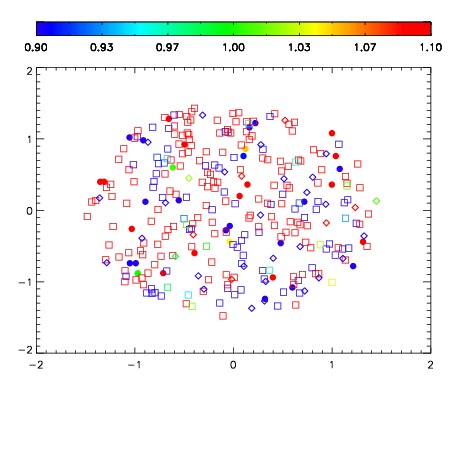
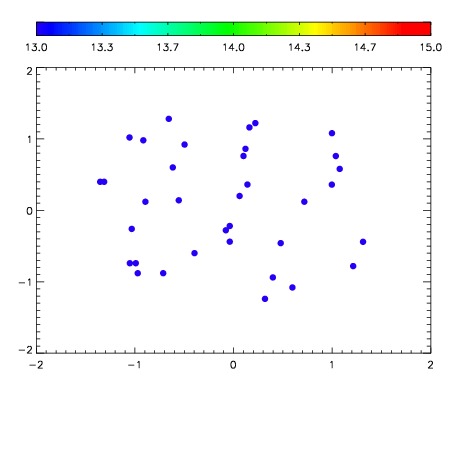

| Frame | Nreads | Zeropoints | Mag plots | Spatial mag deviation | Spatial sky 16325A emission deviations (filled: sky, open: star) | Spatial sky continuum emission | Spatial sky telluric CO2 absorption deviations (filled: H < 10) | |||||||||||||||||||||||
| 0 | 0 |
|
|
|
|
|
|
| IPAIR | NAME | SHIFT | NEWSHIFT | S/N | NAME | SHIFT | NEWSHIFT | S/N |
| 0 | 12580049 | 0.489732 | 0.00000 | 260.016 | 12580047 | -0.000645330 | 0.490377 | 268.981 |
| 1 | 12580045 | 0.487611 | 0.00212100 | 280.984 | 12580044 | 0.00000 | 0.489732 | 282.535 |
| 2 | 12580046 | 0.488509 | 0.00122300 | 271.540 | 12580048 | 0.000162925 | 0.489569 | 273.440 |
| 3 | 12580050 | 0.489400 | 0.000331998 | 247.134 | 12580051 | 0.000476195 | 0.489256 | 250.588 |