| Red | Green | Blue | |
| z | 17.64 | ||
| znorm | Inf | ||
| sky | -Inf | -Inf | -Inf |
| S/N | 24.2 | 41.5 | 46.0 |
| S/N(c) | 0.0 | 0.0 | 0.0 |
| SN(E/C) |
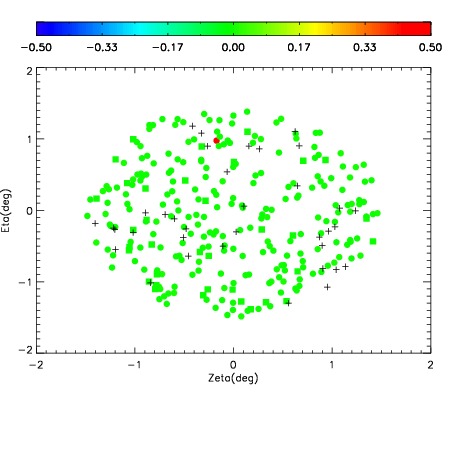
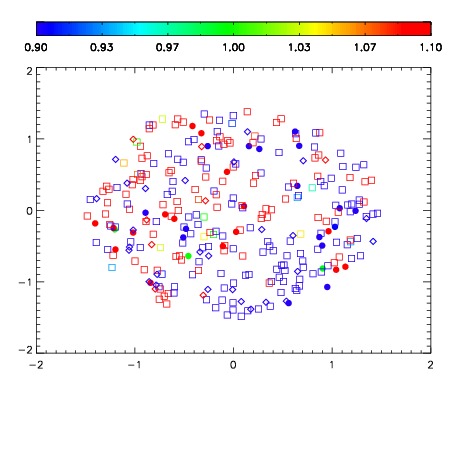
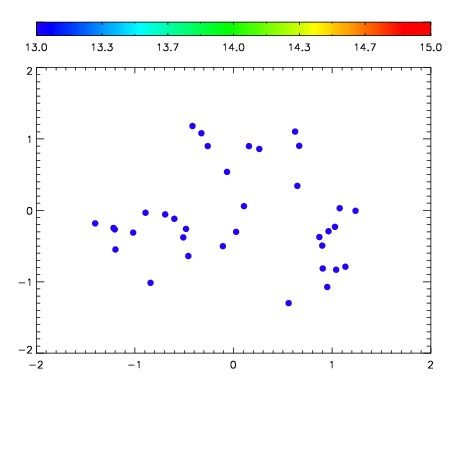

| Frame | Nreads | Zeropoints | Mag plots | Spatial mag deviation | Spatial sky 16325A emission deviations (filled: sky, open: star) | Spatial sky continuum emission | Spatial sky telluric CO2 absorption deviations (filled: H < 10) | |||||||||||||||||||||||
| 0 | 0 |
|
|
|
|
|
|
| IPAIR | NAME | SHIFT | NEWSHIFT | S/N | NAME | SHIFT | NEWSHIFT | S/N |
| 0 | 10450024 | 0.506369 | 0.00000 | 181.808 | 10450025 | -0.000683281 | 0.507052 | 184.261 |
| 1 | 10450028 | 0.505316 | 0.00105298 | 185.277 | 10450029 | 0.000305553 | 0.506063 | 189.726 |
| 2 | 10450023 | 0.505788 | 0.000580966 | 184.896 | 10450022 | 0.00000 | 0.506369 | 188.660 |
| 3 | 10450027 | 0.505007 | 0.00136197 | 176.606 | 10450026 | -0.000745897 | 0.507115 | 183.882 |