| Red | Green | Blue | |
| z | 17.64 | ||
| znorm | Inf | ||
| sky | -Inf | -Inf | -Inf |
| S/N | 16.8 | 28.4 | 32.8 |
| S/N(c) | 0.0 | 0.0 | 0.0 |
| SN(E/C) |
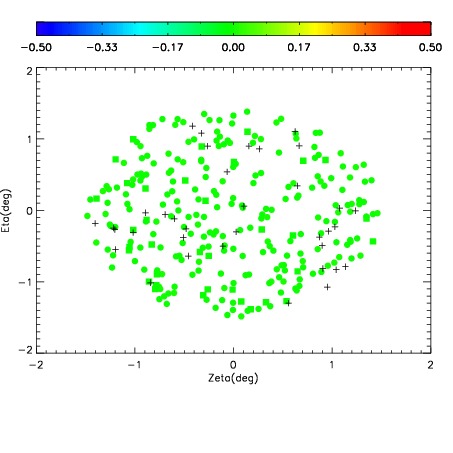
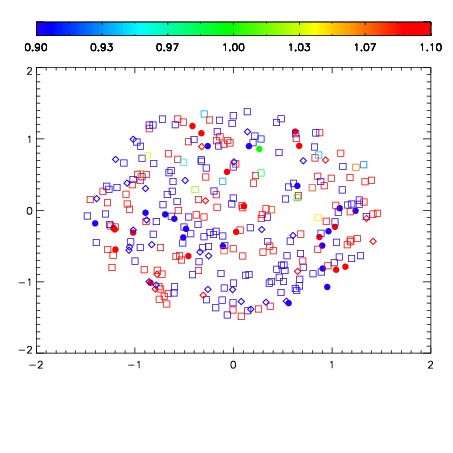
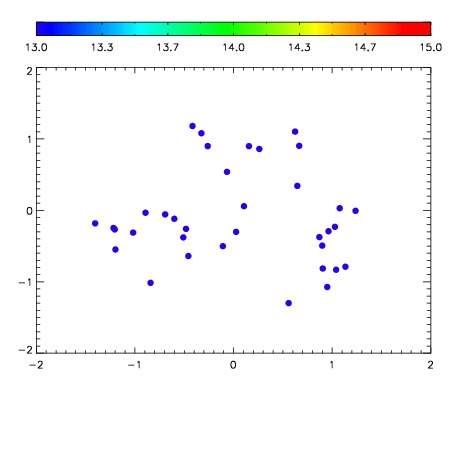

| Frame | Nreads | Zeropoints | Mag plots | Spatial mag deviation | Spatial sky 16325A emission deviations (filled: sky, open: star) | Spatial sky continuum emission | Spatial sky telluric CO2 absorption deviations (filled: H < 10) | |||||||||||||||||||||||
| 0 | 0 |
|
|
|
|
|
|
| IPAIR | NAME | SHIFT | NEWSHIFT | S/N | NAME | SHIFT | NEWSHIFT | S/N |
| 0 | 10670011 | 0.523084 | 0.00000 | 62.1888 | 10670010 | 0.00000 | 0.523084 | 118.637 |
| 1 | 10670016 | 0.519303 | 0.00378096 | 174.666 | 10670017 | -0.00228676 | 0.525371 | 188.229 |
| 2 | 10670015 | 0.519673 | 0.00341100 | 165.793 | 10670013 | -0.00178347 | 0.524867 | 183.707 |
| 3 | 10670012 | 0.521774 | 0.00130999 | 125.882 | 10670014 | -0.00167978 | 0.524764 | 176.316 |