| Red | Green | Blue | |
| z | 17.64 | ||
| znorm | Inf | ||
| sky | -Inf | -Inf | -Inf |
| S/N | 24.1 | 42.9 | 45.7 |
| S/N(c) | 0.0 | 0.0 | 0.0 |
| SN(E/C) |


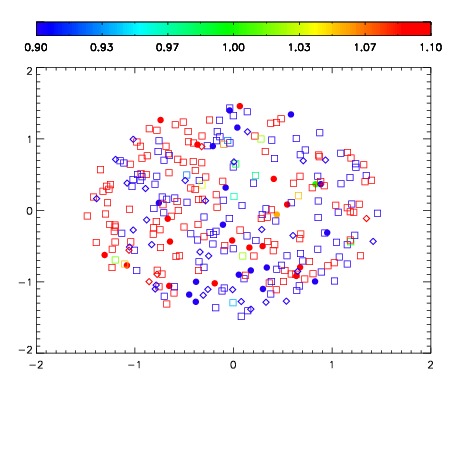


| Frame | Nreads | Zeropoints | Mag plots | Spatial mag deviation | Spatial sky 16325A emission deviations (filled: sky, open: star) | Spatial sky continuum emission | Spatial sky telluric CO2 absorption deviations (filled: H < 10) | |||||||||||||||||||||||
| 0 | 0 |
|
|
|
|
|
|
| IPAIR | NAME | SHIFT | NEWSHIFT | S/N | NAME | SHIFT | NEWSHIFT | S/N |
| 0 | 10460027 | 0.503383 | 0.00000 | 187.921 | 10460033 | 0.000971590 | 0.502411 | 192.113 |
| 1 | 10460032 | 0.501054 | 0.00232899 | 196.980 | 10460029 | 0.00257441 | 0.500809 | 193.666 |
| 2 | 10460031 | 0.500931 | 0.00245196 | 195.446 | 10460030 | 0.00295859 | 0.500424 | 192.202 |
| 3 | 10460028 | 0.502838 | 0.000544965 | 185.713 | 10460026 | 0.00000 | 0.503383 | 176.076 |