| Red | Green | Blue | |
| z | 17.65 | ||
| znorm | Inf | ||
| sky | -Inf | -Inf | -Inf |
| S/N | 5.3 | 11.7 | 10.8 |
| S/N(c) | 0.0 | 0.0 | 0.0 |
| SN(E/C) |
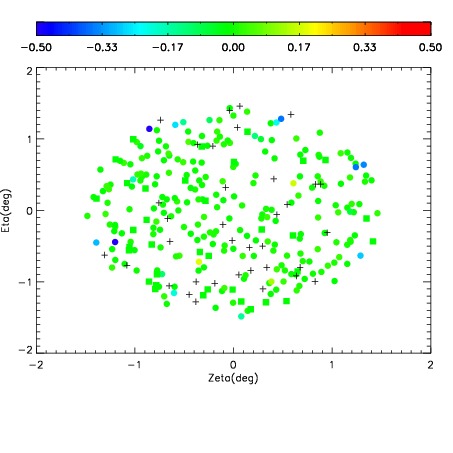
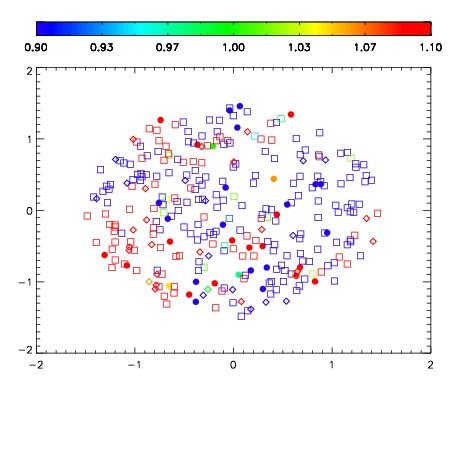
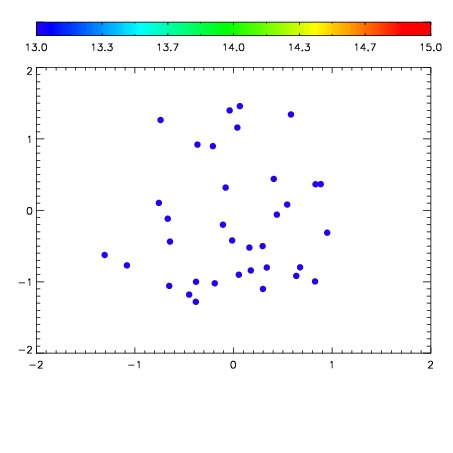

| Frame | Nreads | Zeropoints | Mag plots | Spatial mag deviation | Spatial sky 16325A emission deviations (filled: sky, open: star) | Spatial sky continuum emission | Spatial sky telluric CO2 absorption deviations (filled: H < 10) | |||||||||||||||||||||||
| 0 | 0 |
|
|
|
|
|
|
| IPAIR | NAME | SHIFT | NEWSHIFT | S/N | NAME | SHIFT | NEWSHIFT | S/N |
| 0 | 10680012 | 0.509080 | 0.00000 | 93.2902 | 10680018 | 0.000441518 | 0.508639 | 83.1992 |
| 1 | 10680013 | 0.508989 | 9.10163e-05 | 82.5135 | 10680014 | -0.00175201 | 0.510832 | 77.7835 |
| 2 | 10680017 | 0.507360 | 0.00172001 | 76.8506 | 10680011 | 0.00000 | 0.509080 | 72.0167 |
| 3 | 10680016 | 0.507316 | 0.00176400 | 58.7743 | 10680015 | -0.00180463 | 0.510885 | 31.8580 |