| Red | Green | Blue | |
| z | 17.64 | ||
| znorm | Inf | ||
| sky | -Inf | -NaN | -Inf |
| S/N | 20.0 | 34.8 | 36.4 |
| S/N(c) | 0.0 | 0.0 | 0.0 |
| SN(E/C) |
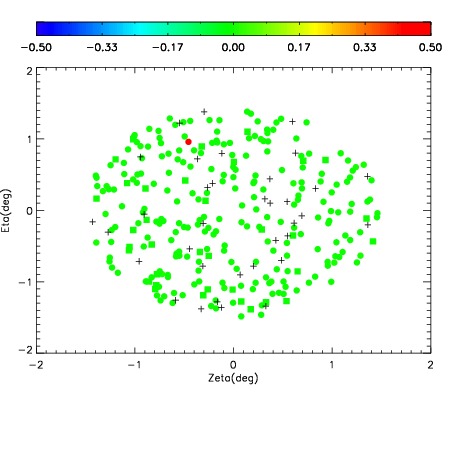
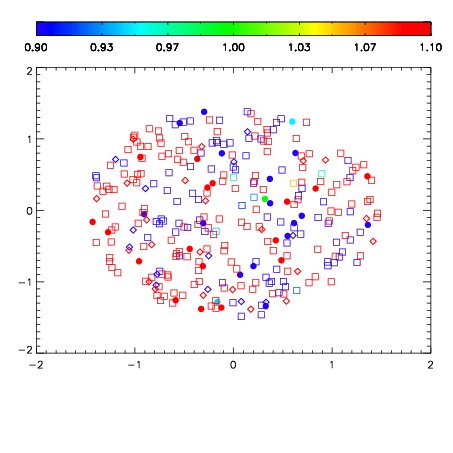
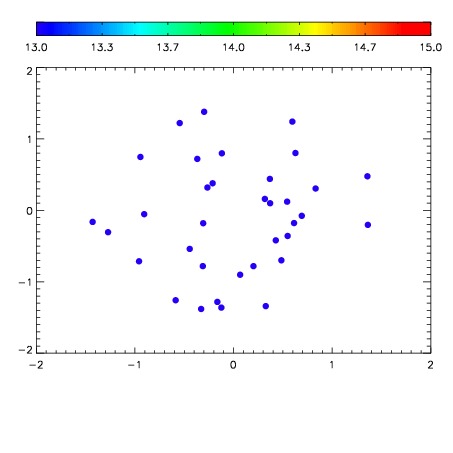

| Frame | Nreads | Zeropoints | Mag plots | Spatial mag deviation | Spatial sky 16325A emission deviations (filled: sky, open: star) | Spatial sky continuum emission | Spatial sky telluric CO2 absorption deviations (filled: H < 10) | |||||||||||||||||||||||
| 0 | 0 |
|
|
|
|
|
|
| IPAIR | NAME | SHIFT | NEWSHIFT | S/N | NAME | SHIFT | NEWSHIFT | S/N |
| 0 | 10740023 | 0.494136 | 0.00000 | 161.043 | 10740022 | 0.00000 | 0.494136 | 166.789 |
| 1 | 10740028 | 0.494098 | 3.79980e-05 | 174.850 | 10740029 | -0.00214905 | 0.496285 | 169.800 |
| 2 | 10740027 | 0.493791 | 0.000344992 | 162.373 | 10740026 | -0.00194416 | 0.496080 | 169.573 |
| 3 | 10740024 | 0.493996 | 0.000140011 | 149.266 | 10740025 | -0.00138465 | 0.495521 | 163.354 |