| Red | Green | Blue | |
| z | 17.64 | ||
| znorm | Inf | ||
| sky | -Inf | -Inf | -Inf |
| S/N | 21.4 | 36.0 | 41.4 |
| S/N(c) | 0.0 | 0.0 | 0.0 |
| SN(E/C) |
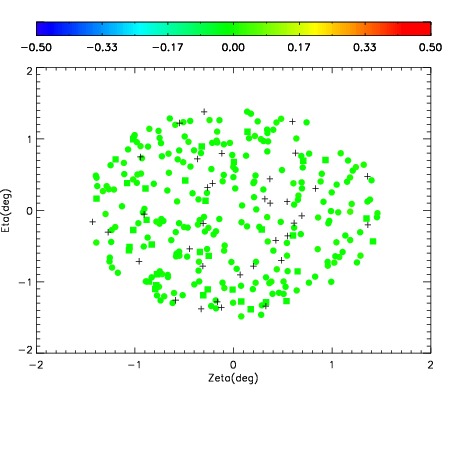
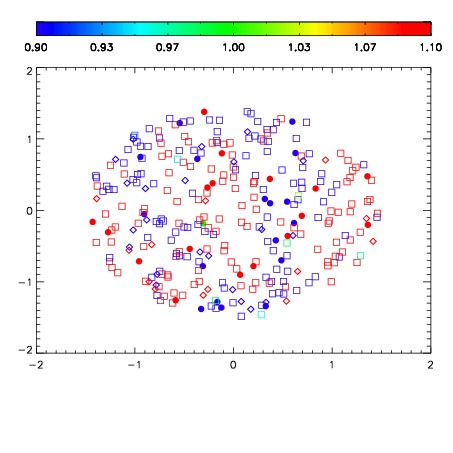
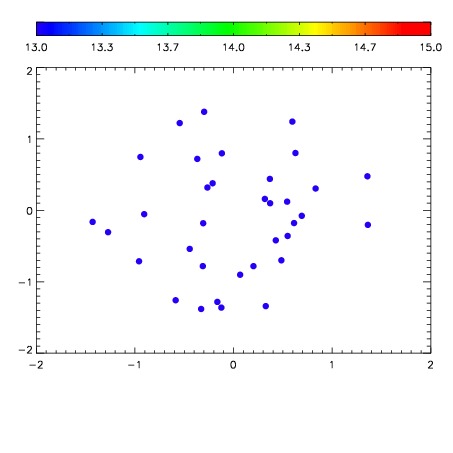

| Frame | Nreads | Zeropoints | Mag plots | Spatial mag deviation | Spatial sky 16325A emission deviations (filled: sky, open: star) | Spatial sky continuum emission | Spatial sky telluric CO2 absorption deviations (filled: H < 10) | |||||||||||||||||||||||
| 0 | 0 |
|
|
|
|
|
|
| IPAIR | NAME | SHIFT | NEWSHIFT | S/N | NAME | SHIFT | NEWSHIFT | S/N |
| 0 | 10760019 | 0.494260 | 0.00000 | 180.667 | 10760016 | -0.000102653 | 0.494363 | 183.105 |
| 1 | 10760015 | 0.492863 | 0.00139701 | 196.215 | 10760017 | 0.000399845 | 0.493860 | 184.879 |
| 2 | 10760018 | 0.493791 | 0.000468999 | 190.078 | 10760020 | 9.11532e-07 | 0.494259 | 183.476 |
| 3 | 10760014 | 0.493196 | 0.00106400 | 165.936 | 10760013 | 0.00000 | 0.494260 | 145.849 |