| Red | Green | Blue | |
| z | 17.64 | ||
| znorm | Inf | ||
| sky | -NaN | -Inf | -Inf |
| S/N | 23.7 | 39.6 | 44.5 |
| S/N(c) | 0.0 | 0.0 | 0.0 |
| SN(E/C) |
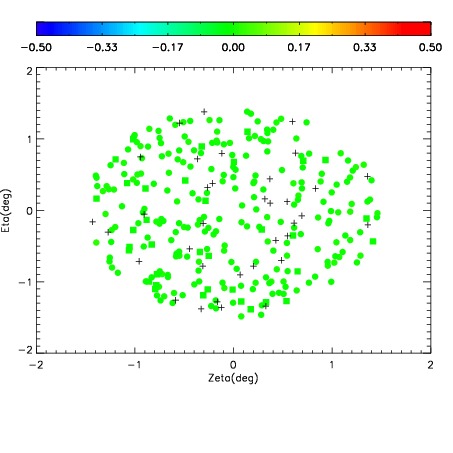
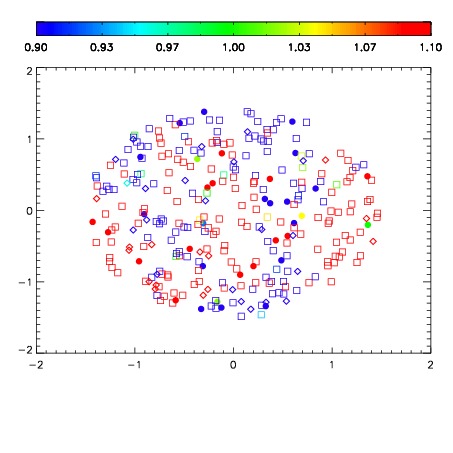
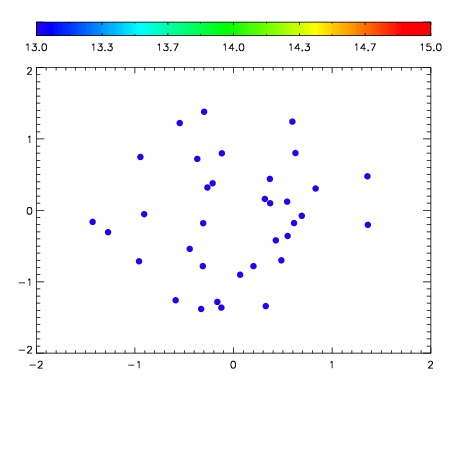

| Frame | Nreads | Zeropoints | Mag plots | Spatial mag deviation | Spatial sky 16325A emission deviations (filled: sky, open: star) | Spatial sky continuum emission | Spatial sky telluric CO2 absorption deviations (filled: H < 10) | |||||||||||||||||||||||
| 0 | 0 |
|
|
|
|
|
|
| IPAIR | NAME | SHIFT | NEWSHIFT | S/N | NAME | SHIFT | NEWSHIFT | S/N |
| 0 | 10790016 | 0.492632 | 0.00000 | 179.740 | 10790014 | -0.00284118 | 0.495473 | 177.714 |
| 1 | 10790011 | 0.491700 | 0.000932008 | 201.530 | 10790010 | 0.00000 | 0.492632 | 195.460 |
| 2 | 10790012 | 0.491500 | 0.00113201 | 189.096 | 10790013 | -0.00362427 | 0.496256 | 187.658 |
| 3 | 10790015 | 0.492129 | 0.000503004 | 185.183 | 10790017 | -0.00224235 | 0.494874 | 184.676 |