| Red | Green | Blue | |
| z | 17.64 | ||
| znorm | Inf | ||
| sky | -Inf | -Inf | -Inf |
| S/N | 21.3 | 37.7 | 39.3 |
| S/N(c) | 0.0 | 0.0 | 0.0 |
| SN(E/C) |
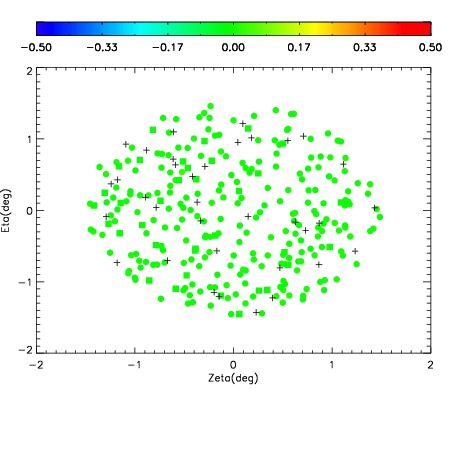
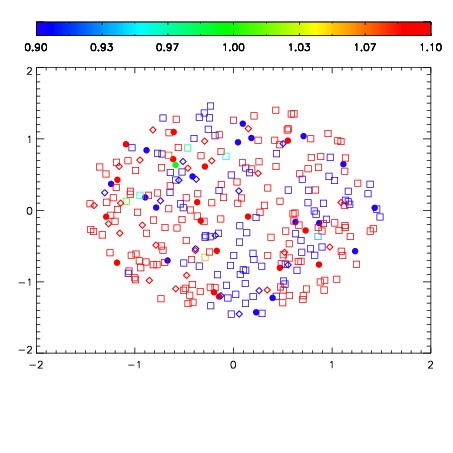
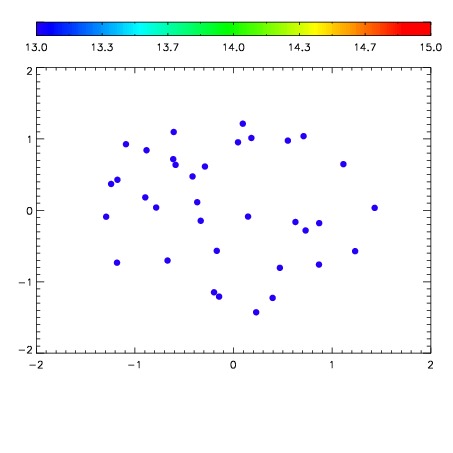

| Frame | Nreads | Zeropoints | Mag plots | Spatial mag deviation | Spatial sky 16325A emission deviations (filled: sky, open: star) | Spatial sky continuum emission | Spatial sky telluric CO2 absorption deviations (filled: H < 10) | |||||||||||||||||||||||
| 0 | 0 |
|
|
|
|
|
|
| IPAIR | NAME | SHIFT | NEWSHIFT | S/N | NAME | SHIFT | NEWSHIFT | S/N |
| 0 | 10610013 | 0.508833 | 0.00000 | 201.920 | 10610015 | 0.00243805 | 0.506395 | 197.280 |
| 1 | 10610012 | 0.508770 | 6.30021e-05 | 205.457 | 10610011 | 0.00000 | 0.508833 | 203.161 |
| 2 | 10610016 | 0.507873 | 0.000959992 | 186.999 | 10610014 | 0.00307832 | 0.505755 | 193.835 |
| 3 | 10610017 | 0.508415 | 0.000418007 | 185.387 | 10610018 | 0.00381388 | 0.505019 | 171.551 |