| Red | Green | Blue | |
| z | 17.64 | ||
| znorm | Inf | ||
| sky | -Inf | -NaN | -NaN |
| S/N | 27.2 | 42.3 | 47.9 |
| S/N(c) | 0.0 | 0.0 | 0.0 |
| SN(E/C) |
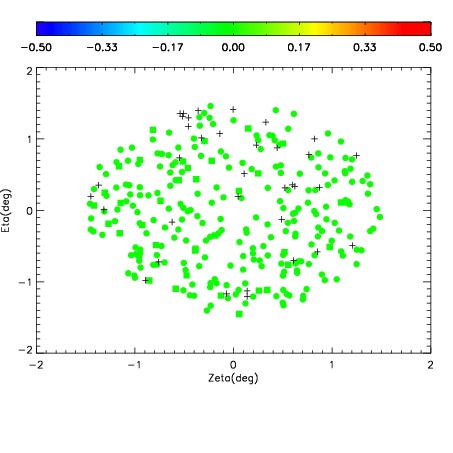
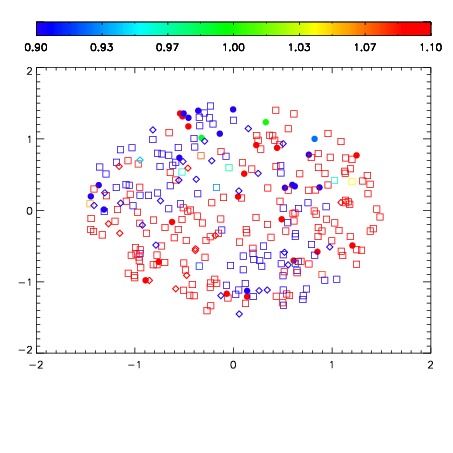
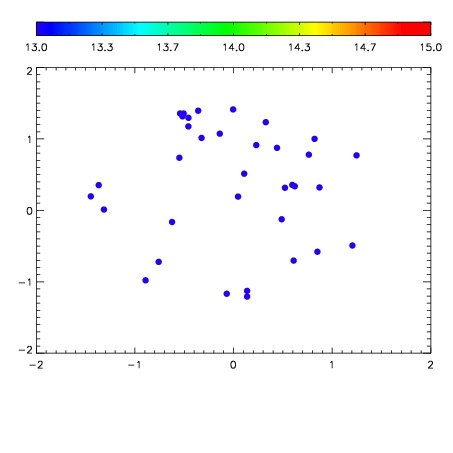

| Frame | Nreads | Zeropoints | Mag plots | Spatial mag deviation | Spatial sky 16325A emission deviations (filled: sky, open: star) | Spatial sky continuum emission | Spatial sky telluric CO2 absorption deviations (filled: H < 10) | |||||||||||||||||||||||
| 0 | 0 |
|
|
|
|
|
|
| IPAIR | NAME | SHIFT | NEWSHIFT | S/N | NAME | SHIFT | NEWSHIFT | S/N |
| 0 | 10640020 | 0.502008 | 0.00000 | 163.612 | 10640019 | 0.00342807 | 0.498580 | 166.074 |
| 1 | 10640016 | 0.501018 | 0.000990033 | 178.539 | 10640014 | 0.00198401 | 0.500024 | 176.790 |
| 2 | 10640013 | 0.501750 | 0.000258029 | 175.903 | 10640015 | 0.00223301 | 0.499775 | 170.706 |
| 3 | 10640012 | 0.501768 | 0.000240028 | 175.325 | 10640011 | 0.00000 | 0.502008 | 167.038 |
| 4 | 10640017 | 0.501024 | 0.000984013 | 162.129 | 10640018 | 0.00342281 | 0.498585 | 157.678 |