| Red | Green | Blue | |
| z | 17.64 | ||
| znorm | Inf | ||
| sky | -Inf | -Inf | -Inf |
| S/N | 21.1 | 38.8 | 43.4 |
| S/N(c) | 0.0 | 0.0 | 0.0 |
| SN(E/C) |
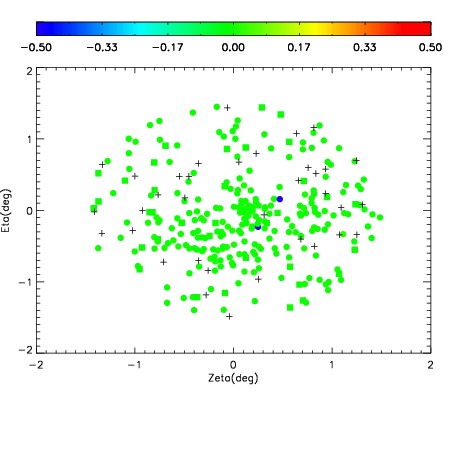
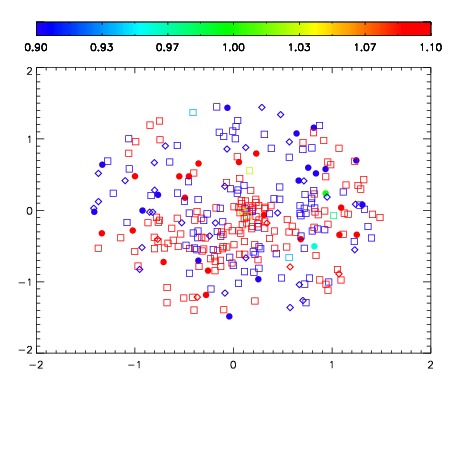
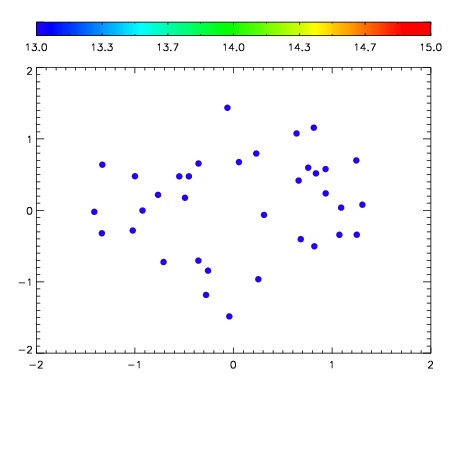

| Frame | Nreads | Zeropoints | Mag plots | Spatial mag deviation | Spatial sky 16325A emission deviations (filled: sky, open: star) | Spatial sky continuum emission | Spatial sky telluric CO2 absorption deviations (filled: H < 10) | |||||||||||||||||||||||
| 0 | 0 |
|
|
|
|
|
|
| IPAIR | NAME | SHIFT | NEWSHIFT | S/N | NAME | SHIFT | NEWSHIFT | S/N |
| 0 | 12730060 | 0.487088 | 0.00000 | 103.193 | 12730055 | 0.00000 | 0.487088 | 137.468 |
| 1 | 12730057 | 0.485879 | 0.00120899 | 197.931 | 12730058 | 0.000141839 | 0.486946 | 205.506 |
| 2 | 12730056 | 0.484997 | 0.00209099 | 186.007 | 12730059 | 0.000320922 | 0.486767 | 198.187 |
| 3 | 12730061 | 0.486843 | 0.000245005 | 150.479 | 12730062 | 2.47341e-05 | 0.487063 | 186.268 |