| Red | Green | Blue | |
| z | 17.64 | ||
| znorm | Inf | ||
| sky | -Inf | -Inf | -Inf |
| S/N | 27.2 | 45.6 | 53.8 |
| S/N(c) | 0.0 | 0.0 | 0.0 |
| SN(E/C) |

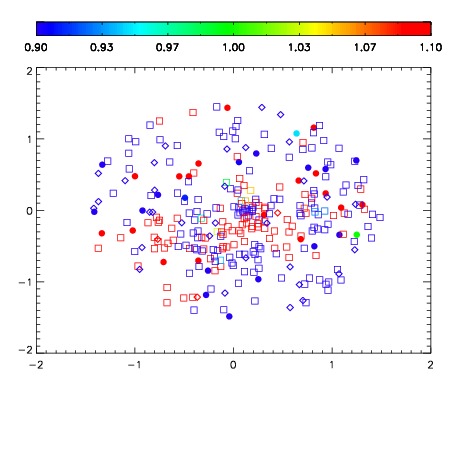
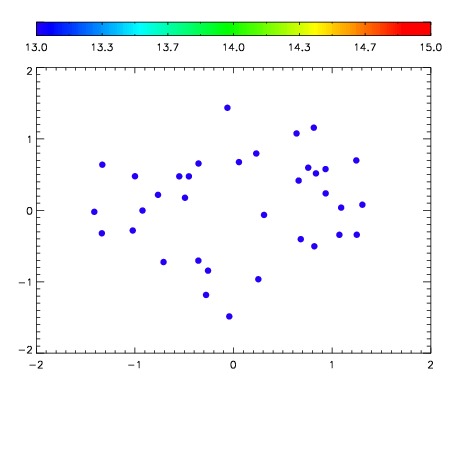

| Frame | Nreads | Zeropoints | Mag plots | Spatial mag deviation | Spatial sky 16325A emission deviations (filled: sky, open: star) | Spatial sky continuum emission | Spatial sky telluric CO2 absorption deviations (filled: H < 10) | |||||||||||||||||||||||
| 0 | 0 |
|
|
|
|
|
|
| IPAIR | NAME | SHIFT | NEWSHIFT | S/N | NAME | SHIFT | NEWSHIFT | S/N |
| 0 | 12750052 | 0.487078 | 0.00000 | 198.849 | 12750047 | 0.00000 | 0.487078 | 198.147 |
| 1 | 12750053 | 0.486916 | 0.000162005 | 200.840 | 12750054 | -0.000298404 | 0.487376 | 201.735 |
| 2 | 12750048 | 0.486179 | 0.000899017 | 196.038 | 12750051 | -0.00208601 | 0.489164 | 197.333 |
| 3 | 12750049 | 0.486185 | 0.000892997 | 193.686 | 12750050 | -0.00295730 | 0.490035 | 196.405 |