| Red | Green | Blue | |
| z | 17.64 | ||
| znorm | Inf | ||
| sky | -Inf | -Inf | -Inf |
| S/N | 32.5 | 54.1 | 55.8 |
| S/N(c) | 0.0 | 0.0 | 0.0 |
| SN(E/C) |


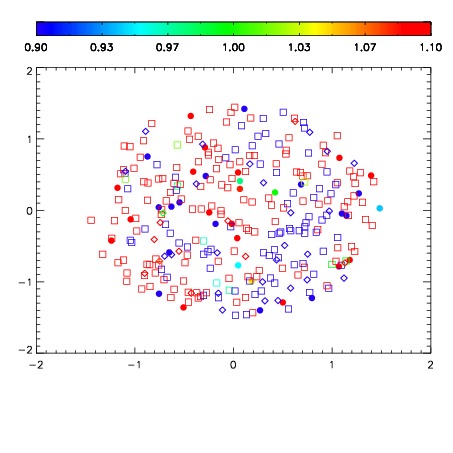


| Frame | Nreads | Zeropoints | Mag plots | Spatial mag deviation | Spatial sky 16325A emission deviations (filled: sky, open: star) | Spatial sky continuum emission | Spatial sky telluric CO2 absorption deviations (filled: H < 10) | |||||||||||||||||||||||
| 0 | 0 |
|
|
|
|
|
|
| IPAIR | NAME | SHIFT | NEWSHIFT | S/N | NAME | SHIFT | NEWSHIFT | S/N |
| 0 | 10260015 | 0.495045 | 0.00000 | 207.285 | 10260013 | 0.00168724 | 0.493358 | 207.110 |
| 1 | 10260016 | 0.494965 | 8.00192e-05 | 207.264 | 10260014 | 0.00168022 | 0.493365 | 206.629 |
| 2 | 10260012 | 0.493204 | 0.00184101 | 205.648 | 10260017 | -0.000275189 | 0.495320 | 206.454 |
| 3 | 10260011 | 0.492821 | 0.00222400 | 202.491 | 10260010 | 0.00000 | 0.495045 | 200.895 |