| Red | Green | Blue | |
| z | 17.64 | ||
| znorm | Inf | ||
| sky | -Inf | -Inf | -Inf |
| S/N | 21.8 | 36.4 | 38.1 |
| S/N(c) | 0.0 | 0.0 | 0.0 |
| SN(E/C) |

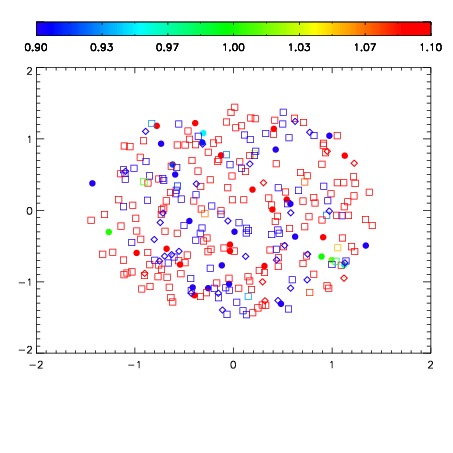


| Frame | Nreads | Zeropoints | Mag plots | Spatial mag deviation | Spatial sky 16325A emission deviations (filled: sky, open: star) | Spatial sky continuum emission | Spatial sky telluric CO2 absorption deviations (filled: H < 10) | |||||||||||||||||||||||
| 0 | 0 |
|
|
|
|
|
|
| IPAIR | NAME | SHIFT | NEWSHIFT | S/N | NAME | SHIFT | NEWSHIFT | S/N |
| 0 | 10280017 | 0.498854 | 0.00000 | 203.976 | 10280015 | 0.00158133 | 0.497273 | 194.380 |
| 1 | 10280013 | 0.497346 | 0.00150800 | 245.475 | 10280011 | 0.00000 | 0.498854 | 248.490 |
| 2 | 10280016 | 0.498614 | 0.000239998 | 196.860 | 10280014 | 0.00146128 | 0.497393 | 190.531 |
| 3 | 10280012 | 0.497042 | 0.00181201 | 120.534 | 10280018 | 0.000692199 | 0.498162 | -4.33660e-09 |