| Red | Green | Blue | |
| z | 17.64 | ||
| znorm | Inf | ||
| sky | -Inf | -Inf | -Inf |
| S/N | 29.6 | 47.1 | 48.4 |
| S/N(c) | 0.0 | 0.0 | 0.0 |
| SN(E/C) |
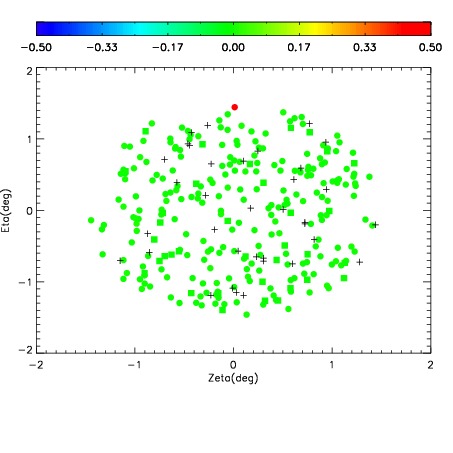
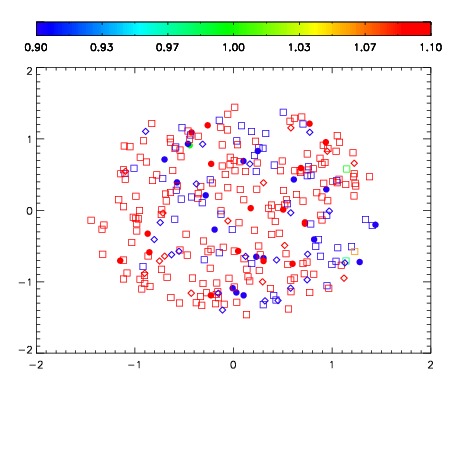
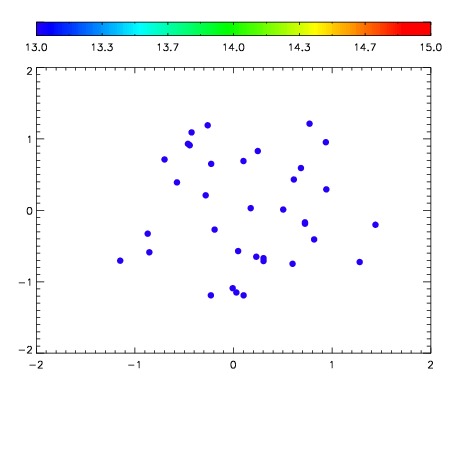

| Frame | Nreads | Zeropoints | Mag plots | Spatial mag deviation | Spatial sky 16325A emission deviations (filled: sky, open: star) | Spatial sky continuum emission | Spatial sky telluric CO2 absorption deviations (filled: H < 10) | |||||||||||||||||||||||
| 0 | 0 |
|
|
|
|
|
|
| IPAIR | NAME | SHIFT | NEWSHIFT | S/N | NAME | SHIFT | NEWSHIFT | S/N |
| 0 | 10310013 | 0.511073 | 0.00000 | 224.008 | 10310014 | 0.00236190 | 0.508711 | 223.332 |
| 1 | 10310012 | 0.511009 | 6.40154e-05 | 224.441 | 10310018 | 0.00176097 | 0.509312 | 223.971 |
| 2 | 10310016 | 0.510012 | 0.00106102 | 224.189 | 10310015 | 0.00228235 | 0.508791 | 223.530 |
| 3 | 10310017 | 0.510547 | 0.000526011 | 223.832 | 10310011 | 0.00000 | 0.511073 | 220.252 |