| Red | Green | Blue | |
| z | 17.64 | ||
| znorm | Inf | ||
| sky | -Inf | -NaN | -Inf |
| S/N | 36.5 | 54.3 | 59.6 |
| S/N(c) | 0.0 | 0.0 | 0.0 |
| SN(E/C) |
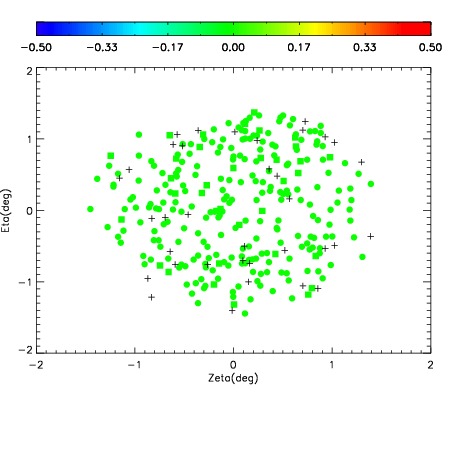
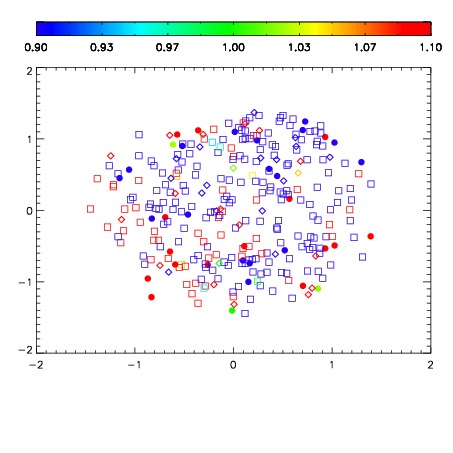
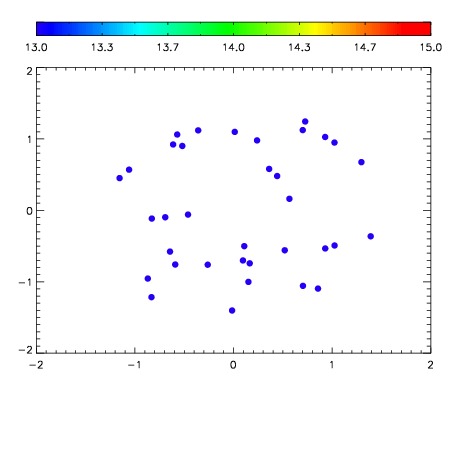

| Frame | Nreads | Zeropoints | Mag plots | Spatial mag deviation | Spatial sky 16325A emission deviations (filled: sky, open: star) | Spatial sky continuum emission | Spatial sky telluric CO2 absorption deviations (filled: H < 10) | |||||||||||||||||||||||
| 0 | 0 |
|
|
|
|
|
|
| IPAIR | NAME | SHIFT | NEWSHIFT | S/N | NAME | SHIFT | NEWSHIFT | S/N |
| 0 | 10530012 | 0.497641 | 0.00000 | 214.039 | 10530011 | 0.00000 | 0.497641 | 214.476 |
| 1 | 10530013 | 0.497503 | 0.000137985 | 210.787 | 10530015 | 0.00112596 | 0.496515 | 209.602 |
| 2 | 10530017 | 0.494808 | 0.00283301 | 207.378 | 10530014 | 0.00145945 | 0.496182 | 208.288 |
| 3 | 10530016 | 0.494822 | 0.00281900 | 207.224 | 10530018 | 0.00249839 | 0.495143 | 204.500 |