| Red | Green | Blue | |
| z | 17.64 | ||
| znorm | Inf | ||
| sky | -Inf | -Inf | -Inf |
| S/N | 33.5 | 50.9 | 56.2 |
| S/N(c) | 0.0 | 0.0 | 0.0 |
| SN(E/C) |

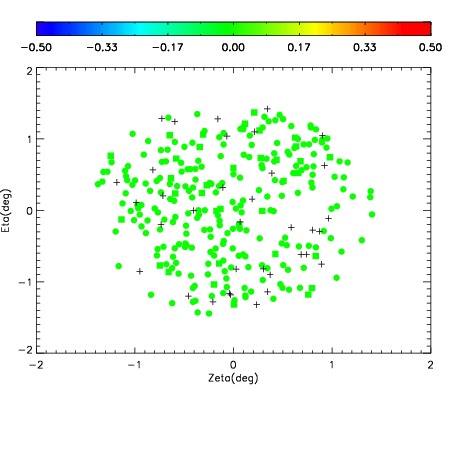
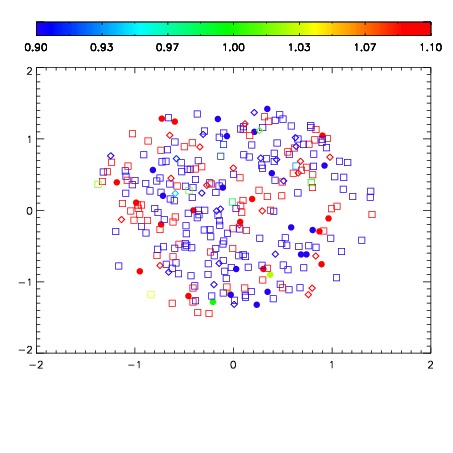
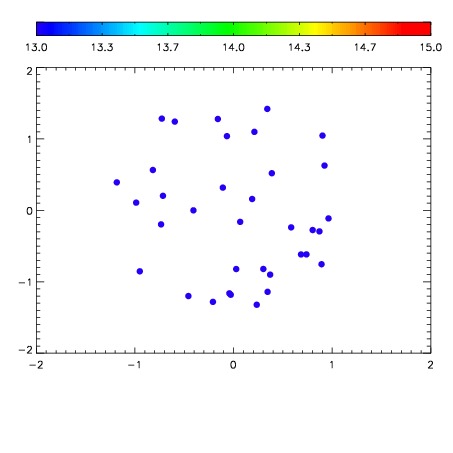

| Frame | Nreads | Zeropoints | Mag plots | Spatial mag deviation | Spatial sky 16325A emission deviations (filled: sky, open: star) | Spatial sky continuum emission | Spatial sky telluric CO2 absorption deviations (filled: H < 10) | |||||||||||||||||||||||
| 0 | 0 |
|
|
|
|
|
|
| IPAIR | NAME | SHIFT | NEWSHIFT | S/N | NAME | SHIFT | NEWSHIFT | S/N |
| 0 | 10540013 | 0.503141 | 0.00000 | 208.909 | 10540014 | 0.00305898 | 0.500082 | 214.423 |
| 1 | 10540016 | 0.501319 | 0.00182199 | 215.242 | 10540015 | 0.00253278 | 0.500608 | 214.708 |
| 2 | 10540017 | 0.501102 | 0.00203902 | 208.047 | 10540018 | 0.000505588 | 0.502635 | 204.396 |
| 3 | 10540012 | 0.503029 | 0.000111997 | 195.481 | 10540011 | 0.00000 | 0.503141 | 183.071 |