| Red | Green | Blue | |
| z | 17.64 | ||
| znorm | Inf | ||
| sky | -Inf | -NaN | -Inf |
| S/N | 27.5 | 43.0 | 46.9 |
| S/N(c) | 0.0 | 0.0 | 0.0 |
| SN(E/C) |
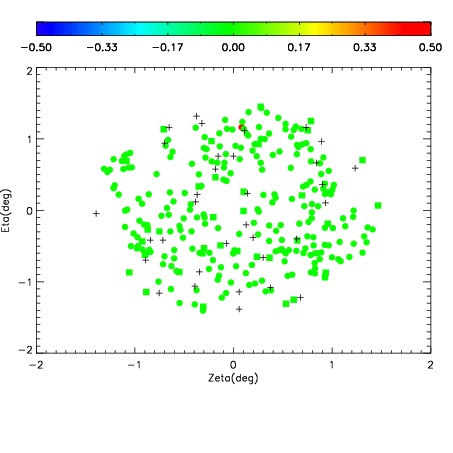
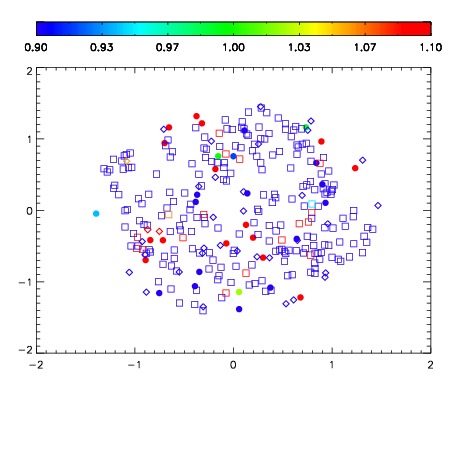
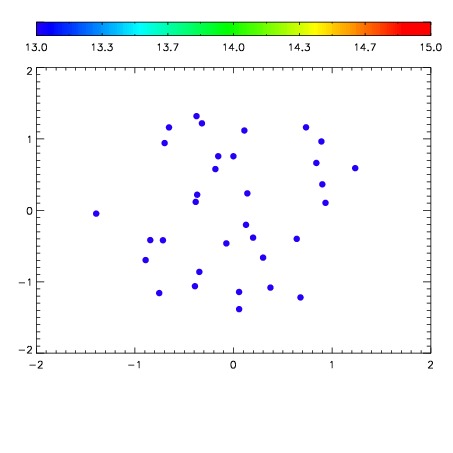

| Frame | Nreads | Zeropoints | Mag plots | Spatial mag deviation | Spatial sky 16325A emission deviations (filled: sky, open: star) | Spatial sky continuum emission | Spatial sky telluric CO2 absorption deviations (filled: H < 10) | |||||||||||||||||||||||
| 0 | 0 |
|
|
|
|
|
|
| IPAIR | NAME | SHIFT | NEWSHIFT | S/N | NAME | SHIFT | NEWSHIFT | S/N |
| 0 | 12080012 | 0.492450 | 0.00000 | 28.2542 | 12080011 | 0.00000 | 0.492450 | 23.2572 |
| 1 | 12080017 | 0.484653 | 0.00779700 | 43.2271 | 12080018 | -0.00522745 | 0.497677 | 44.3105 |
| 2 | 12080016 | 0.485351 | 0.00709900 | 39.8081 | 12080014 | -0.00657728 | 0.499027 | 37.1052 |
| 3 | 12080013 | 0.491696 | 0.000753999 | 34.4199 | 12080015 | -0.00735974 | 0.499810 | 37.0616 |