| Red | Green | Blue | |
| z | 17.64 | ||
| znorm | Inf | ||
| sky | -Inf | -Inf | -Inf |
| S/N | 27.8 | 44.3 | 48.9 |
| S/N(c) | 0.0 | 0.0 | 0.0 |
| SN(E/C) |
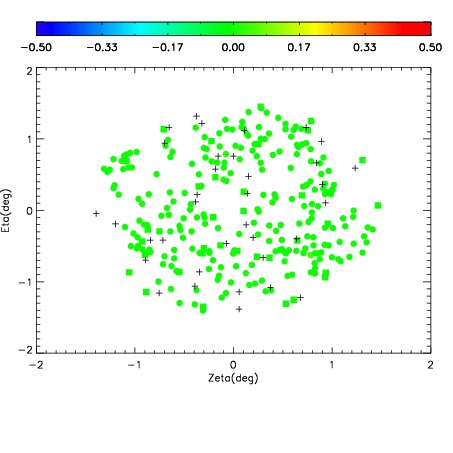
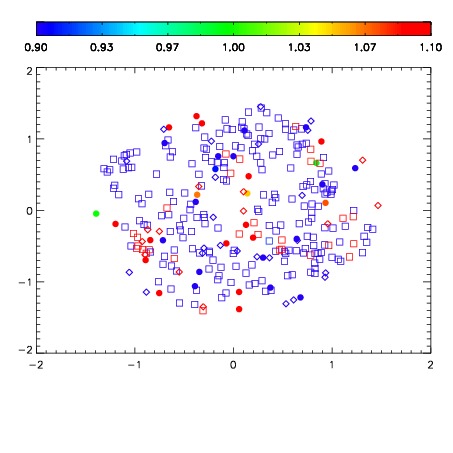
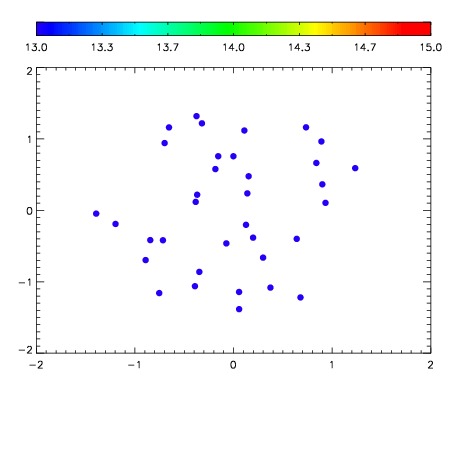

| Frame | Nreads | Zeropoints | Mag plots | Spatial mag deviation | Spatial sky 16325A emission deviations (filled: sky, open: star) | Spatial sky continuum emission | Spatial sky telluric CO2 absorption deviations (filled: H < 10) | |||||||||||||||||||||||
| 0 | 0 |
|
|
|
|
|
|
| IPAIR | NAME | SHIFT | NEWSHIFT | S/N | NAME | SHIFT | NEWSHIFT | S/N |
| 0 | 12320057 | 0.490378 | 0.00000 | 41.1858 | 12320058 | -0.00163513 | 0.492013 | 32.2278 |
| 1 | 12320061 | 0.488442 | 0.00193599 | 46.6446 | 12320062 | -0.00423746 | 0.494615 | 47.7267 |
| 2 | 12320056 | 0.489419 | 0.000958979 | 43.8741 | 12320059 | -0.00188607 | 0.492264 | 42.0711 |
| 3 | 12320060 | 0.487058 | 0.00331998 | 42.9644 | 12320055 | 0.00000 | 0.490378 | 39.7649 |