| Red | Green | Blue | |
| z | 17.64 | ||
| znorm | Inf | ||
| sky | -NaN | -NaN | -Inf |
| S/N | 34.2 | 52.0 | 58.1 |
| S/N(c) | 0.0 | 0.0 | 0.0 |
| SN(E/C) |
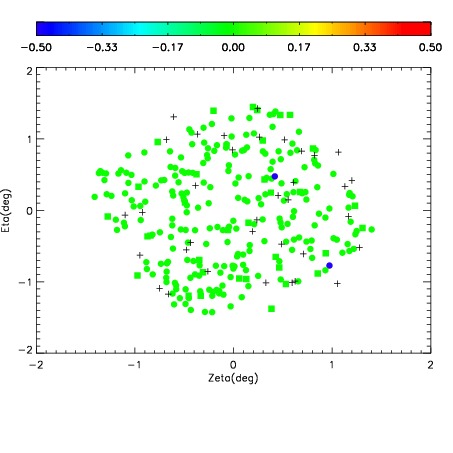
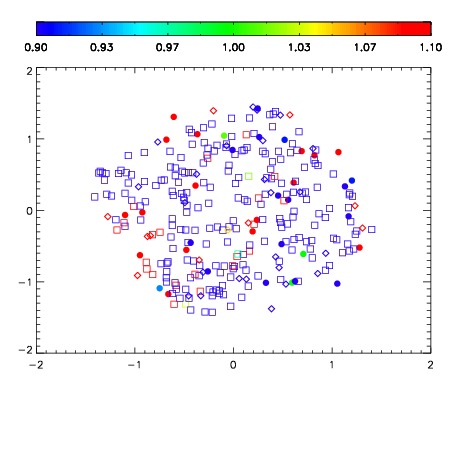
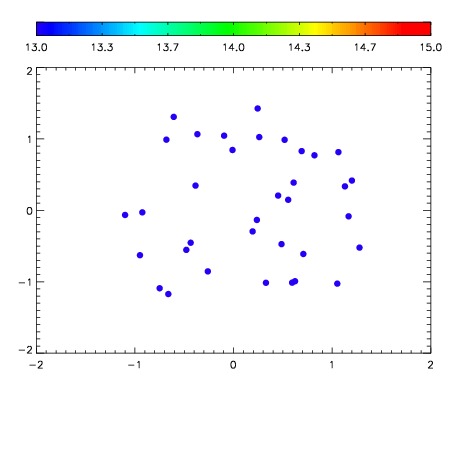

| Frame | Nreads | Zeropoints | Mag plots | Spatial mag deviation | Spatial sky 16325A emission deviations (filled: sky, open: star) | Spatial sky continuum emission | Spatial sky telluric CO2 absorption deviations (filled: H < 10) | |||||||||||||||||||||||
| 0 | 0 |
|
|
|
|
|
|
| IPAIR | NAME | SHIFT | NEWSHIFT | S/N | NAME | SHIFT | NEWSHIFT | S/N |
| 0 | 12010041 | 0.501198 | 0.00000 | 227.935 | 12010044 | -0.00349525 | 0.504693 | 230.853 |
| 1 | 12010046 | 0.499821 | 0.00137699 | 231.285 | 12010047 | -0.00514776 | 0.506346 | 235.274 |
| 2 | 12010045 | 0.500158 | 0.00103998 | 229.882 | 12010043 | -0.00296222 | 0.504160 | 231.869 |
| 3 | 12010042 | 0.501091 | 0.000106990 | 227.934 | 12010040 | 0.00000 | 0.501198 | 227.721 |