| Red | Green | Blue | |
| z | 17.64 | ||
| znorm | Inf | ||
| sky | -Inf | -Inf | -Inf |
| S/N | 27.4 | 41.2 | 44.6 |
| S/N(c) | 0.0 | 0.0 | 0.0 |
| SN(E/C) |
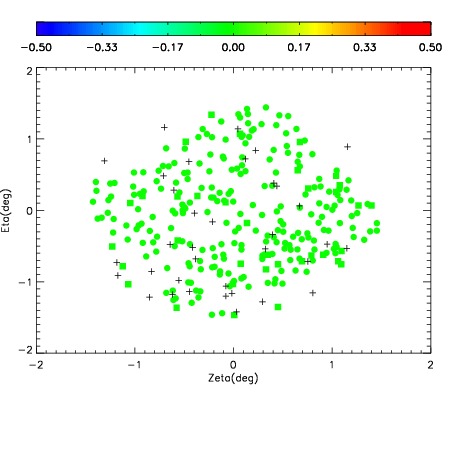
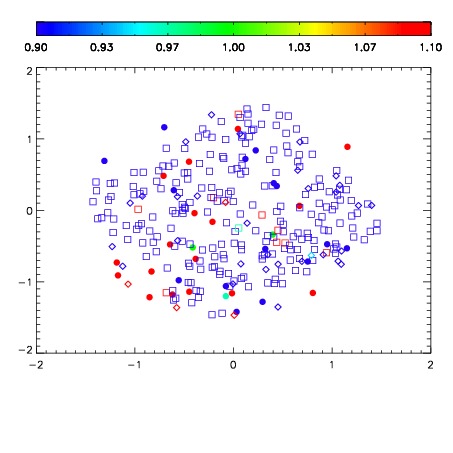
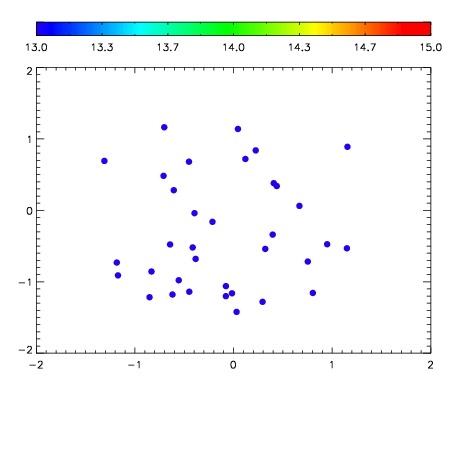

| Frame | Nreads | Zeropoints | Mag plots | Spatial mag deviation | Spatial sky 16325A emission deviations (filled: sky, open: star) | Spatial sky continuum emission | Spatial sky telluric CO2 absorption deviations (filled: H < 10) | |||||||||||||||||||||||
| 0 | 0 |
|
|
|
|
|
|
| IPAIR | NAME | SHIFT | NEWSHIFT | S/N | NAME | SHIFT | NEWSHIFT | S/N |
| 0 | 08940016 | 0.481093 | 0.00000 | 198.971 | 08940015 | 0.00181269 | 0.479280 | 202.875 |
| 1 | 08940012 | 0.478673 | 0.00241998 | 214.578 | 08940011 | 0.00000 | 0.481093 | 214.243 |
| 2 | 08940013 | 0.477737 | 0.00335598 | 213.689 | 08940014 | 0.00291925 | 0.478174 | 204.331 |