| Red | Green | Blue | |
| z | 17.64 | ||
| znorm | Inf | ||
| sky | -Inf | -NaN | -Inf |
| S/N | 30.5 | 45.7 | 48.9 |
| S/N(c) | 0.0 | 0.0 | 0.0 |
| SN(E/C) |
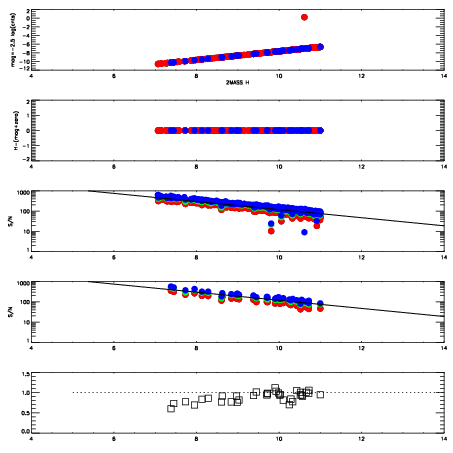
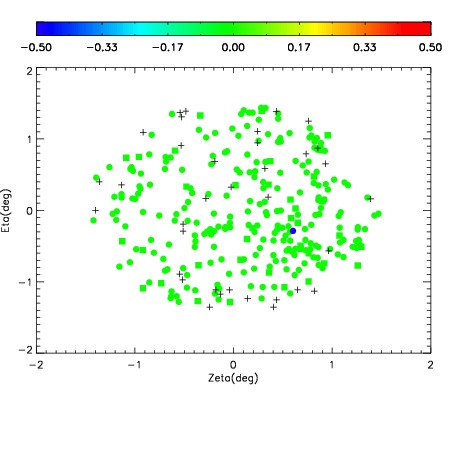
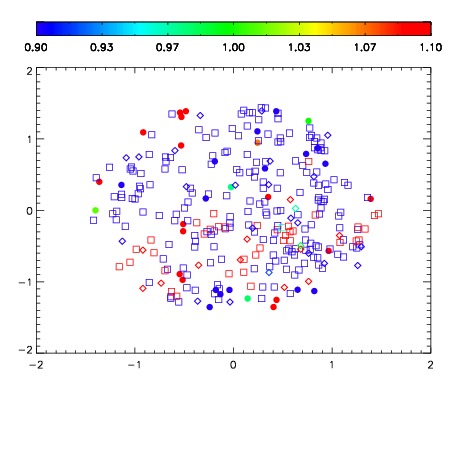
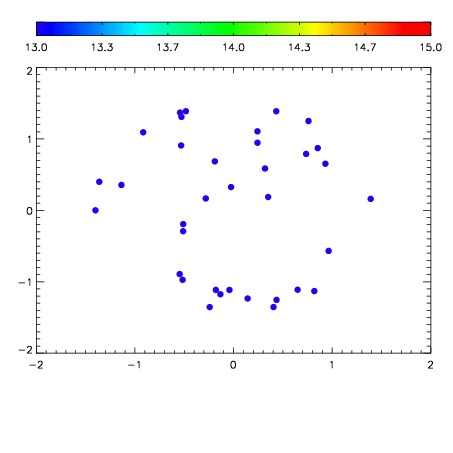

| Frame | Nreads | Zeropoints | Mag plots | Spatial mag deviation | Spatial sky 16325A emission deviations (filled: sky, open: star) | Spatial sky continuum emission | Spatial sky telluric CO2 absorption deviations (filled: H < 10) | |||||||||||||||||||||||
| 0 | 0 |
|
|
|
|
|
|
| IPAIR | NAME | SHIFT | NEWSHIFT | S/N | NAME | SHIFT | NEWSHIFT | S/N |
| 0 | 12020036 | 0.499398 | 0.00000 | 198.317 | 12020037 | -0.00300711 | 0.502405 | 197.721 |
| 1 | 12020040 | 0.499041 | 0.000357002 | 200.407 | 12020038 | -0.00325201 | 0.502650 | 197.961 |
| 2 | 12020039 | 0.499013 | 0.000384986 | 195.681 | 12020041 | -0.000994107 | 0.500392 | 190.509 |
| 3 | 12020035 | 0.498816 | 0.000581980 | 190.677 | 12020034 | 0.00000 | 0.499398 | 184.107 |