| Red | Green | Blue | |
| z | 17.64 | ||
| znorm | Inf | ||
| sky | -Inf | -Inf | -Inf |
| S/N | 31.4 | 47.2 | 51.7 |
| S/N(c) | 0.0 | 0.0 | 0.0 |
| SN(E/C) |
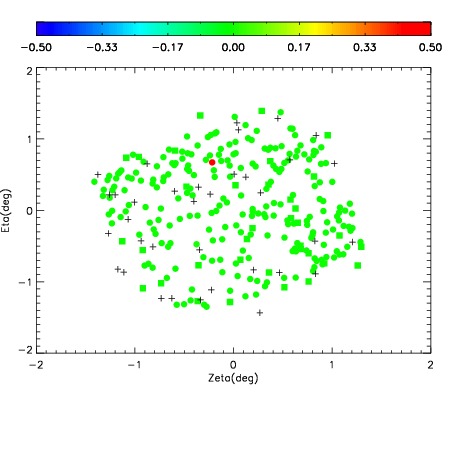
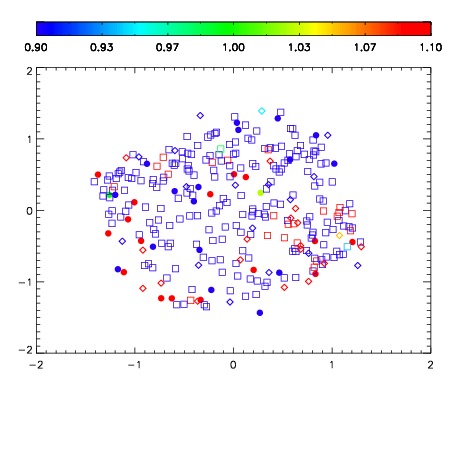
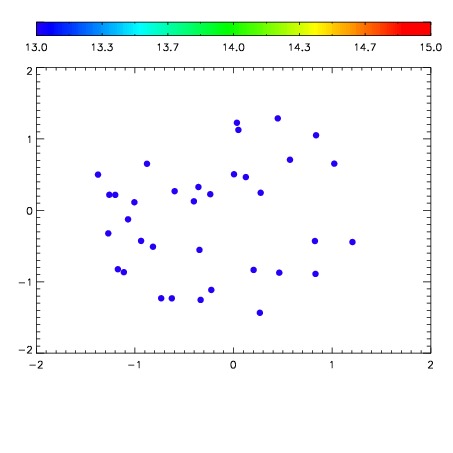

| Frame | Nreads | Zeropoints | Mag plots | Spatial mag deviation | Spatial sky 16325A emission deviations (filled: sky, open: star) | Spatial sky continuum emission | Spatial sky telluric CO2 absorption deviations (filled: H < 10) | |||||||||||||||||||||||
| 0 | 0 |
|
|
|
|
|
|
| IPAIR | NAME | SHIFT | NEWSHIFT | S/N | NAME | SHIFT | NEWSHIFT | S/N |
| 0 | 12090062 | 0.486770 | 0.00000 | 211.548 | 12090063 | -0.00203873 | 0.488809 | 221.510 |
| 1 | 12090066 | 0.486421 | 0.000349015 | 221.902 | 12090064 | -0.00153935 | 0.488309 | 226.698 |
| 2 | 12090065 | 0.485521 | 0.00124902 | 219.278 | 12090067 | -0.00310695 | 0.489877 | 224.452 |
| 3 | 12090061 | 0.486467 | 0.000303000 | 211.221 | 12090060 | 0.00000 | 0.486770 | 208.910 |