| Red | Green | Blue | |
| z | 17.64 | ||
| znorm | Inf | ||
| sky | -Inf | -NaN | -Inf |
| S/N | 31.9 | 48.6 | 52.6 |
| S/N(c) | 0.0 | 0.0 | 0.0 |
| SN(E/C) |


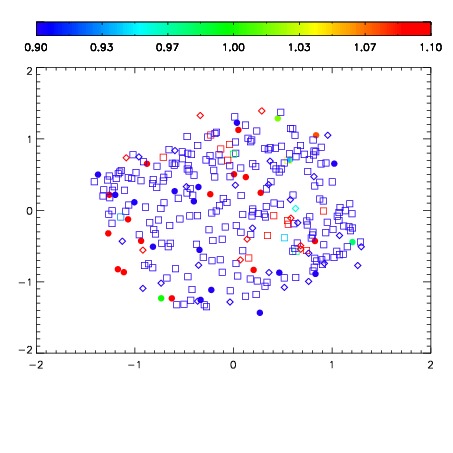


| Frame | Nreads | Zeropoints | Mag plots | Spatial mag deviation | Spatial sky 16325A emission deviations (filled: sky, open: star) | Spatial sky continuum emission | Spatial sky telluric CO2 absorption deviations (filled: H < 10) | |||||||||||||||||||||||
| 0 | 0 |
|
|
|
|
|
|
| IPAIR | NAME | SHIFT | NEWSHIFT | S/N | NAME | SHIFT | NEWSHIFT | S/N |
| 0 | 12470017 | 0.486905 | 0.00000 | 227.451 | 12470014 | -0.000530722 | 0.487436 | 204.413 |
| 1 | 12470012 | 0.484274 | 0.00263101 | 237.922 | 12470018 | -0.00400346 | 0.490908 | 235.259 |
| 2 | 12470013 | 0.484466 | 0.00243902 | 236.028 | 12470015 | -0.000252720 | 0.487158 | 226.055 |
| 3 | 12470016 | 0.486844 | 6.10054e-05 | 215.223 | 12470011 | 0.00000 | 0.486905 | 179.539 |