| Red | Green | Blue | |
| z | 17.64 | ||
| znorm | Inf | ||
| sky | -Inf | -Inf | -NaN |
| S/N | 30.5 | 45.9 | 49.2 |
| S/N(c) | 0.0 | 0.0 | 0.0 |
| SN(E/C) |
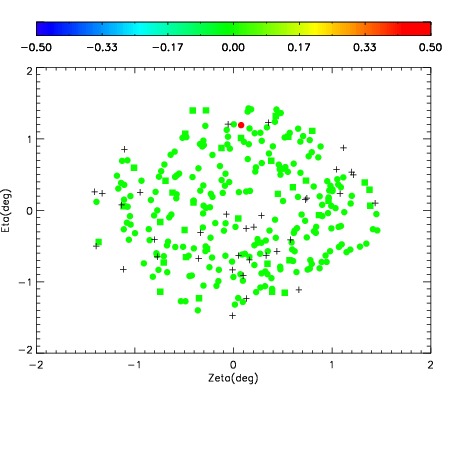
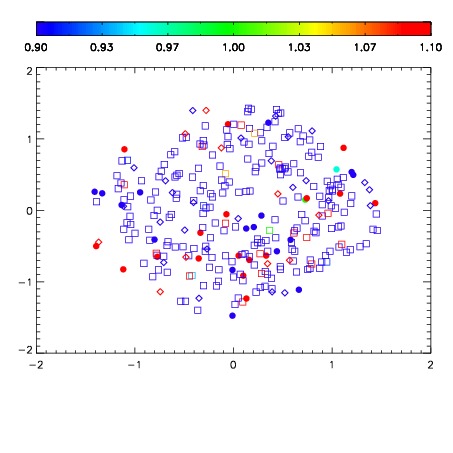
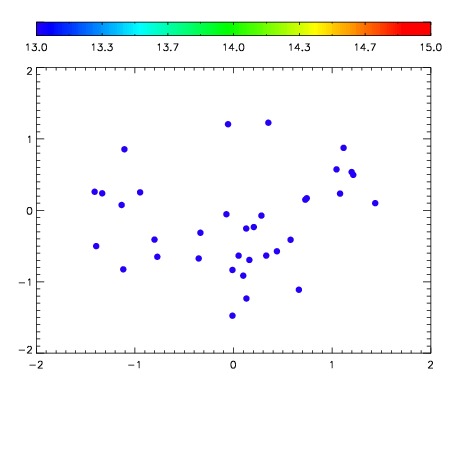

| Frame | Nreads | Zeropoints | Mag plots | Spatial mag deviation | Spatial sky 16325A emission deviations (filled: sky, open: star) | Spatial sky continuum emission | Spatial sky telluric CO2 absorption deviations (filled: H < 10) | |||||||||||||||||||||||
| 0 | 0 |
|
|
|
|
|
|
| IPAIR | NAME | SHIFT | NEWSHIFT | S/N | NAME | SHIFT | NEWSHIFT | S/N |
| 0 | 11840015 | 0.488203 | 0.00000 | 216.635 | 11840010 | 0.00000 | 0.488203 | 221.235 |
| 1 | 11840012 | 0.486602 | 0.00160098 | 228.851 | 11840013 | -0.00272364 | 0.490927 | 231.998 |
| 2 | 11840011 | 0.485702 | 0.00250098 | 226.707 | 11840014 | -0.00285749 | 0.491060 | 226.727 |