| Red | Green | Blue | |
| z | 17.64 | ||
| znorm | Inf | ||
| sky | -Inf | -Inf | -Inf |
| S/N | 33.3 | 50.4 | 54.0 |
| S/N(c) | 0.0 | 0.0 | 0.0 |
| SN(E/C) |
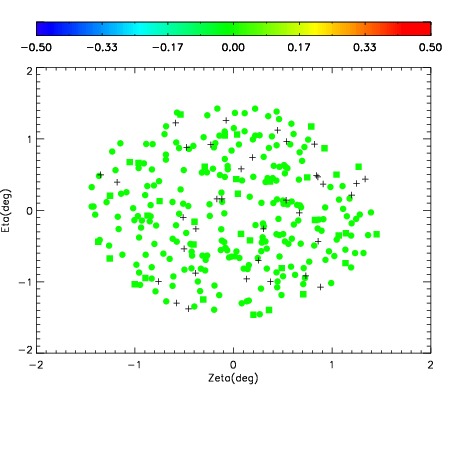
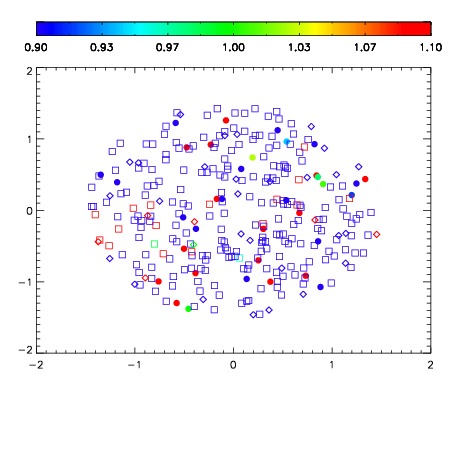
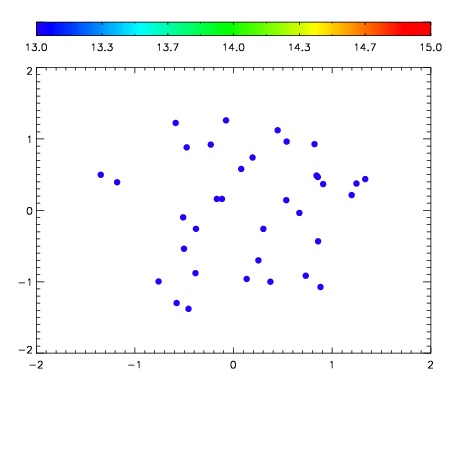

| Frame | Nreads | Zeropoints | Mag plots | Spatial mag deviation | Spatial sky 16325A emission deviations (filled: sky, open: star) | Spatial sky continuum emission | Spatial sky telluric CO2 absorption deviations (filled: H < 10) | |||||||||||||||||||||||
| 0 | 0 |
|
|
|
|
|
|
| IPAIR | NAME | SHIFT | NEWSHIFT | S/N | NAME | SHIFT | NEWSHIFT | S/N |
| 0 | 08860016 | 0.490768 | 0.00000 | 243.662 | 08860013 | 0.00536841 | 0.485400 | 241.581 |
| 1 | 08860011 | 0.482625 | 0.00814298 | 239.412 | 08860014 | 0.00597519 | 0.484793 | 240.286 |
| 2 | 08860015 | 0.489795 | 0.000972986 | 239.195 | 08860010 | 0.00000 | 0.490768 | 238.188 |
| 3 | 08860012 | 0.483349 | 0.00741899 | 237.848 | 08860017 | 0.00924408 | 0.481524 | 237.126 |