| Red | Green | Blue | |
| z | 17.64 | ||
| znorm | Inf | ||
| sky | -NaN | -Inf | -Inf |
| S/N | 26.9 | 41.1 | 44.8 |
| S/N(c) | 0.0 | 0.0 | 0.0 |
| SN(E/C) |
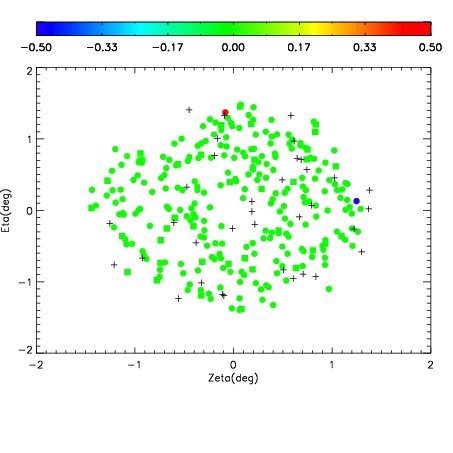
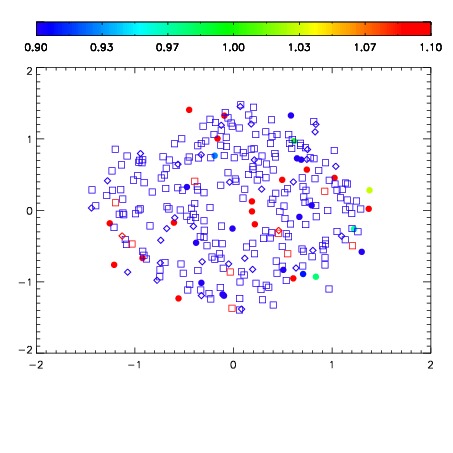
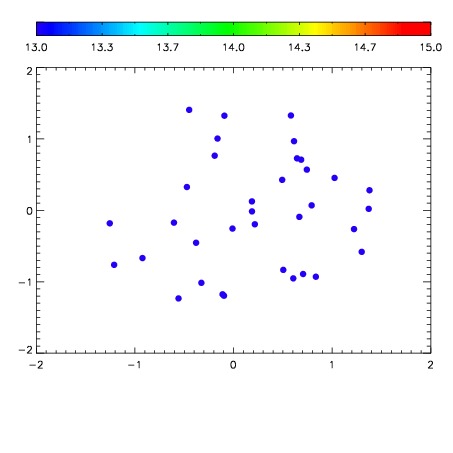

| Frame | Nreads | Zeropoints | Mag plots | Spatial mag deviation | Spatial sky 16325A emission deviations (filled: sky, open: star) | Spatial sky continuum emission | Spatial sky telluric CO2 absorption deviations (filled: H < 10) | |||||||||||||||||||||||
| 0 | 0 |
|
|
|
|
|
|
| IPAIR | NAME | SHIFT | NEWSHIFT | S/N | NAME | SHIFT | NEWSHIFT | S/N |
| 0 | 08890013 | 0.487119 | 0.00000 | 113.609 | 08890014 | 0.000793002 | 0.486326 | 157.096 |
| 1 | 08890016 | 0.479532 | 0.00758699 | 200.733 | 08890015 | -0.000363687 | 0.487483 | 198.395 |
| 2 | 08890017 | 0.479515 | 0.00760400 | 194.519 | 08890018 | -0.00176813 | 0.488887 | 195.511 |
| 3 | 08890012 | 0.486679 | 0.000440001 | 92.6352 | 08890011 | 0.00000 | 0.487119 | 127.205 |