| Red | Green | Blue | |
| z | 17.64 | ||
| znorm | Inf | ||
| sky | -Inf | -Inf | -Inf |
| S/N | 35.5 | 54.6 | 58.4 |
| S/N(c) | 0.0 | 0.0 | 0.0 |
| SN(E/C) |
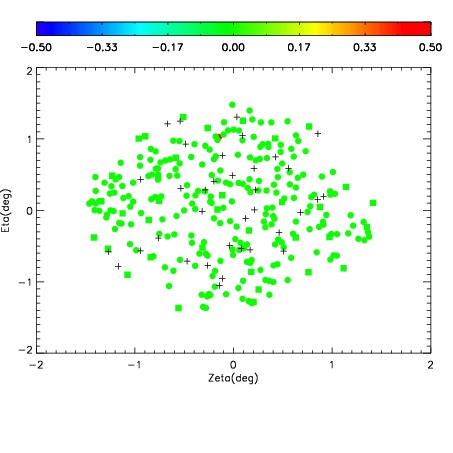
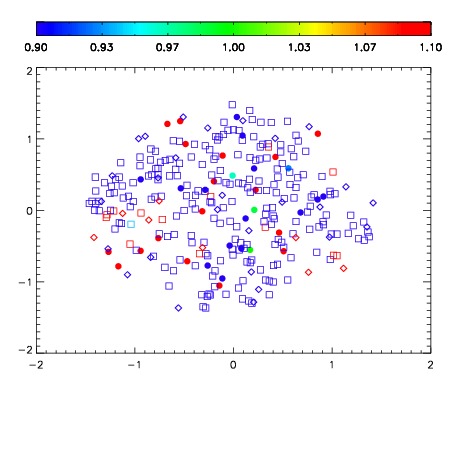
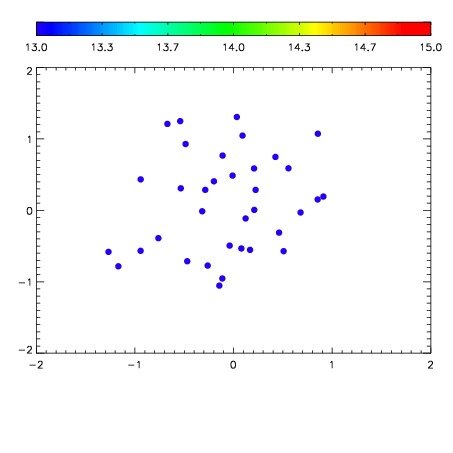

| Frame | Nreads | Zeropoints | Mag plots | Spatial mag deviation | Spatial sky 16325A emission deviations (filled: sky, open: star) | Spatial sky continuum emission | Spatial sky telluric CO2 absorption deviations (filled: H < 10) | |||||||||||||||||||||||
| 0 | 0 |
|
|
|
|
|
|
| IPAIR | NAME | SHIFT | NEWSHIFT | S/N | NAME | SHIFT | NEWSHIFT | S/N |
| 0 | 08900011 | 0.476214 | 0.00000 | 199.866 | 08900013 | 0.00240938 | 0.473805 | 192.626 |
| 1 | 08900016 | 0.472436 | 0.00377798 | 218.184 | 08900018 | 0.00147325 | 0.474741 | 218.909 |
| 2 | 08900015 | 0.471031 | 0.00518298 | 217.589 | 08900017 | 0.00211769 | 0.474096 | 210.667 |
| 3 | 08900019 | 0.468189 | 0.00802499 | 216.796 | 08900014 | 0.00325403 | 0.472960 | 207.590 |
| 4 | 08900012 | 0.475882 | 0.000331998 | 190.786 | 08900010 | 0.00000 | 0.476214 | 189.625 |