| Red | Green | Blue | |
| z | 17.64 | ||
| znorm | Inf | ||
| sky | -Inf | -Inf | -Inf |
| S/N | 25.2 | 38.1 | 44.7 |
| S/N(c) | 0.0 | 0.0 | 0.0 |
| SN(E/C) |
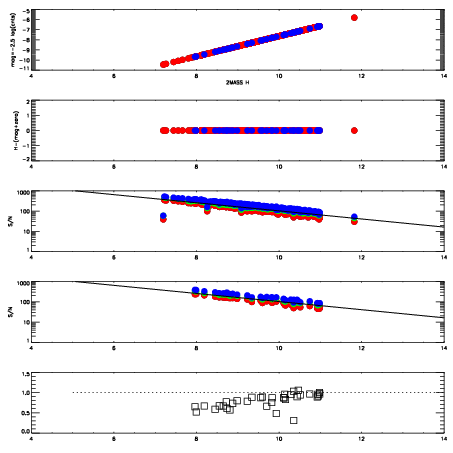
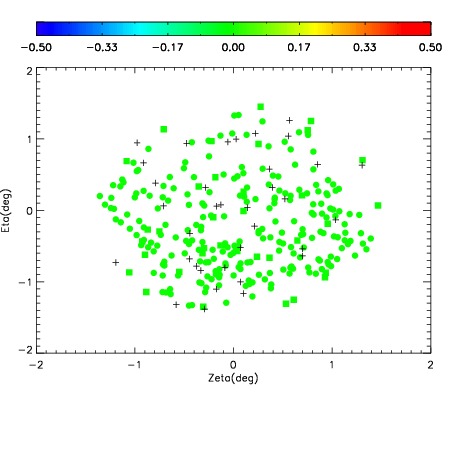
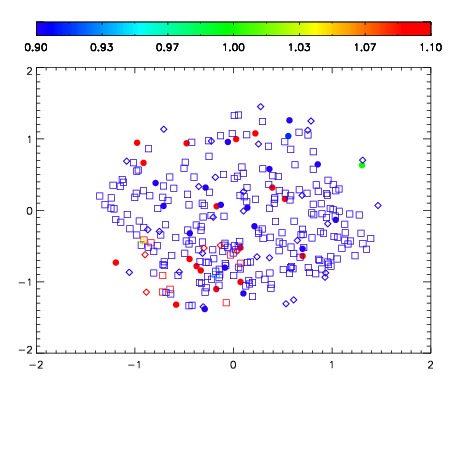


| Frame | Nreads | Zeropoints | Mag plots | Spatial mag deviation | Spatial sky 16325A emission deviations (filled: sky, open: star) | Spatial sky continuum emission | Spatial sky telluric CO2 absorption deviations (filled: H < 10) | |||||||||||||||||||||||
| 0 | 0 |
|
|
|
|
|
|
| IPAIR | NAME | SHIFT | NEWSHIFT | S/N | NAME | SHIFT | NEWSHIFT | S/N |
| 0 | 09030034 | 0.464498 | 0.00000 | 247.316 | 09030033 | 0.00000 | 0.464498 | 247.151 |
| 1 | 09030035 | 0.461036 | 0.00346202 | 246.015 | 09030036 | 0.00246390 | 0.462034 | 244.269 |
| 2 | 09030038 | 0.462906 | 0.00159201 | 215.133 | 09030037 | 0.00172431 | 0.462774 | 243.119 |