| Red | Green | Blue | |
| z | 17.64 | ||
| znorm | Inf | ||
| sky | -Inf | -Inf | -Inf |
| S/N | 28.0 | 44.1 | 52.3 |
| S/N(c) | 0.0 | 0.0 | 0.0 |
| SN(E/C) |
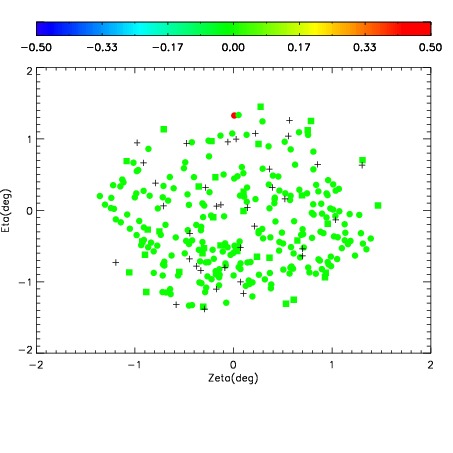
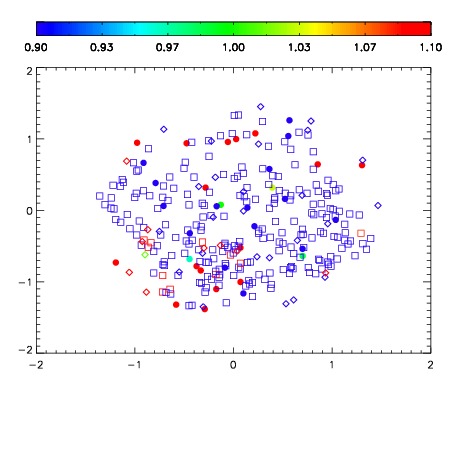
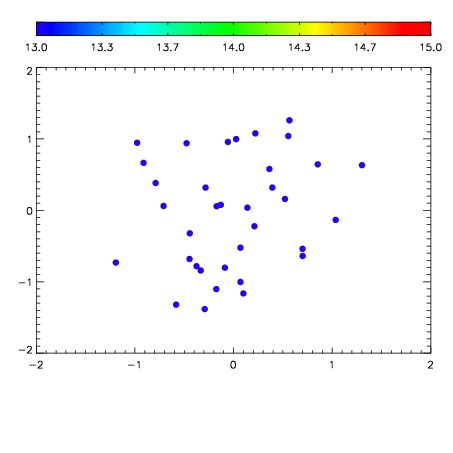

| Frame | Nreads | Zeropoints | Mag plots | Spatial mag deviation | Spatial sky 16325A emission deviations (filled: sky, open: star) | Spatial sky continuum emission | Spatial sky telluric CO2 absorption deviations (filled: H < 10) | |||||||||||||||||||||||
| 0 | 0 |
|
|
|
|
|
|
| IPAIR | NAME | SHIFT | NEWSHIFT | S/N | NAME | SHIFT | NEWSHIFT | S/N |
| 0 | 09080079 | 0.462286 | 0.00000 | 215.555 | 09080078 | 0.00395557 | 0.458330 | 220.712 |
| 1 | 09080071 | 0.454416 | 0.00786999 | 229.203 | 09080070 | 0.00000 | 0.462286 | 234.738 |
| 2 | 09080075 | 0.454147 | 0.00813898 | 227.004 | 09080074 | 0.00500653 | 0.457279 | 230.999 |
| 3 | 09080076 | 0.456418 | 0.00586799 | 224.910 | 09080073 | 0.00548083 | 0.456805 | 226.236 |
| 4 | 09080072 | 0.455011 | 0.00727499 | 222.769 | 09080077 | 0.00360801 | 0.458678 | 225.883 |