| Red | Green | Blue | |
| z | 17.64 | ||
| znorm | Inf | ||
| sky | -Inf | -Inf | -Inf |
| S/N | 26.9 | 40.9 | 45.1 |
| S/N(c) | 0.0 | 0.0 | 0.0 |
| SN(E/C) |
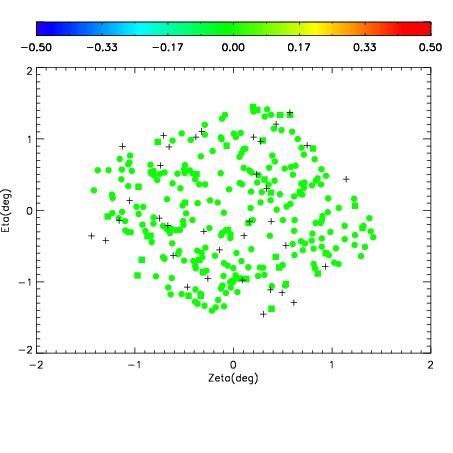
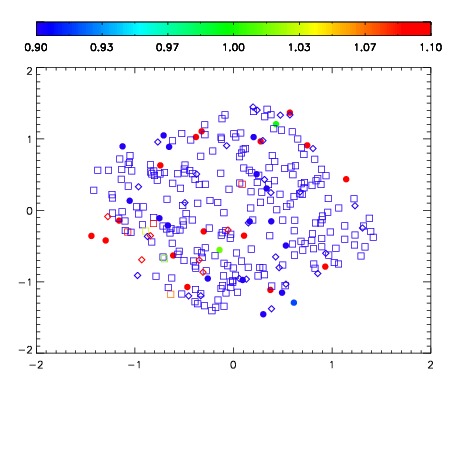
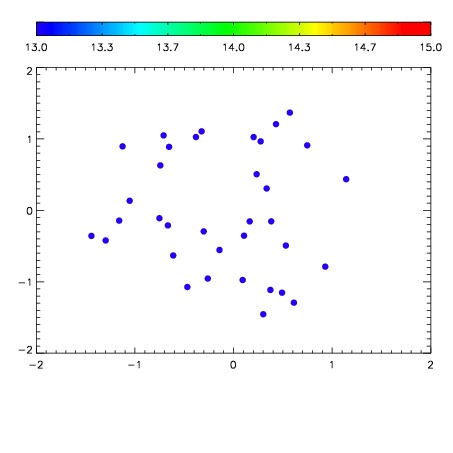

| Frame | Nreads | Zeropoints | Mag plots | Spatial mag deviation | Spatial sky 16325A emission deviations (filled: sky, open: star) | Spatial sky continuum emission | Spatial sky telluric CO2 absorption deviations (filled: H < 10) | |||||||||||||||||||||||
| 0 | 0 |
|
|
|
|
|
|
| IPAIR | NAME | SHIFT | NEWSHIFT | S/N | NAME | SHIFT | NEWSHIFT | S/N |
| 0 | 09010020 | 0.464509 | 0.00000 | 185.551 | 09010026 | 0.00580353 | 0.458705 | 200.753 |
| 1 | 09010021 | 0.462521 | 0.00198802 | 200.214 | 09010022 | 0.00380938 | 0.460700 | 210.584 |
| 2 | 09010024 | 0.463511 | 0.000998020 | 187.296 | 09010023 | 0.00393444 | 0.460575 | 204.981 |
| 3 | 09010025 | 0.463843 | 0.000666022 | 185.377 | 09010019 | 0.00000 | 0.464509 | 187.196 |