| Red | Green | Blue | |
| z | 17.64 | ||
| znorm | Inf | ||
| sky | -Inf | -Inf | -Inf |
| S/N | 30.2 | 44.7 | 48.9 |
| S/N(c) | 0.0 | 0.0 | 0.0 |
| SN(E/C) |
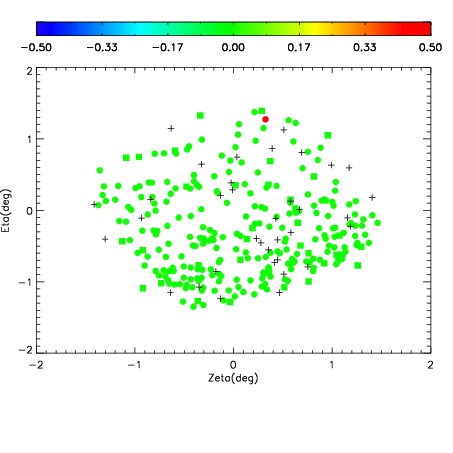
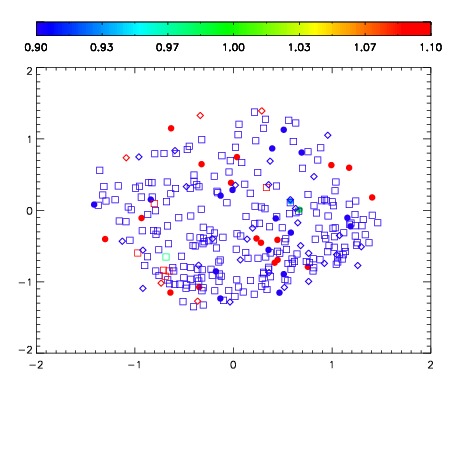
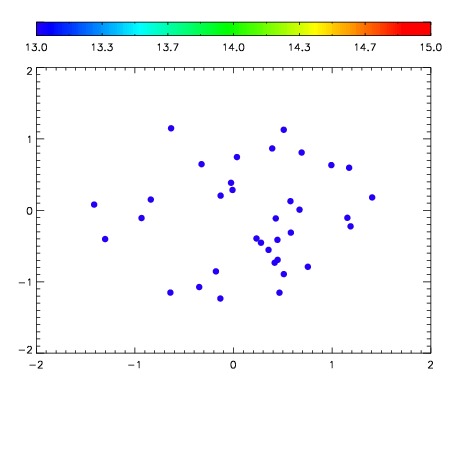

| Frame | Nreads | Zeropoints | Mag plots | Spatial mag deviation | Spatial sky 16325A emission deviations (filled: sky, open: star) | Spatial sky continuum emission | Spatial sky telluric CO2 absorption deviations (filled: H < 10) | |||||||||||||||||||||||
| 0 | 0 |
|
|
|
|
|
|
| IPAIR | NAME | SHIFT | NEWSHIFT | S/N | NAME | SHIFT | NEWSHIFT | S/N |
| 0 | 09020021 | 0.469933 | 0.00000 | 207.830 | 09020019 | 0.00144980 | 0.468483 | 215.163 |
| 1 | 09020018 | 0.465054 | 0.00487900 | 205.417 | 09020016 | 0.00306861 | 0.466864 | 198.792 |
| 2 | 09020017 | 0.463882 | 0.00605100 | 203.171 | 09020015 | 0.00341432 | 0.466519 | 198.292 |
| 3 | 09020014 | 0.464453 | 0.00547999 | 195.234 | 09020012 | 0.00000 | 0.469933 | 185.667 |