| Red | Green | Blue | |
| z | 17.64 | ||
| znorm | Inf | ||
| sky | -Inf | -Inf | -Inf |
| S/N | 6.4 | 13.0 | 15.5 |
| S/N(c) | 0.0 | 0.0 | 0.0 |
| SN(E/C) |
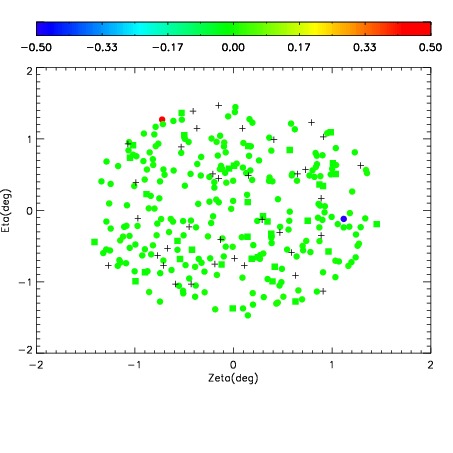
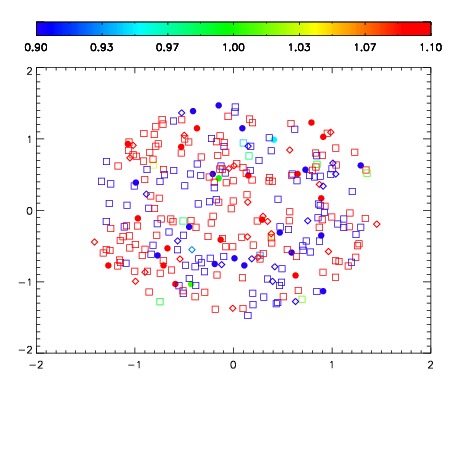
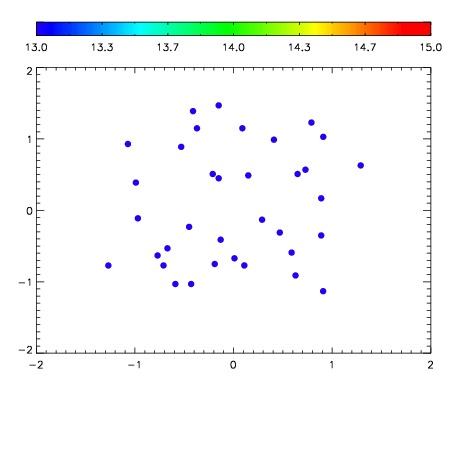

| Frame | Nreads | Zeropoints | Mag plots | Spatial mag deviation | Spatial sky 16325A emission deviations (filled: sky, open: star) | Spatial sky continuum emission | Spatial sky telluric CO2 absorption deviations (filled: H < 10) | |||||||||||||||||||||||
| 0 | 0 |
|
|
|
|
|
|
| IPAIR | NAME | SHIFT | NEWSHIFT | S/N | NAME | SHIFT | NEWSHIFT | S/N |
| 0 | 10550013 | 0.499626 | 0.00000 | 79.4069 | 10550014 | 0.00383139 | 0.495795 | 123.193 |
| 1 | 10550017 | 0.498297 | 0.00132900 | 97.1844 | 10550015 | 0.00330882 | 0.496317 | 129.296 |
| 2 | 10550016 | 0.498413 | 0.00121301 | 56.9857 | 10550011 | 0.00000 | 0.499626 | 41.9279 |