| Red | Green | Blue | |
| z | 17.64 | ||
| znorm | Inf | ||
| sky | -Inf | -Inf | -Inf |
| S/N | 29.1 | 48.7 | 52.6 |
| S/N(c) | 0.0 | 0.0 | 0.0 |
| SN(E/C) |
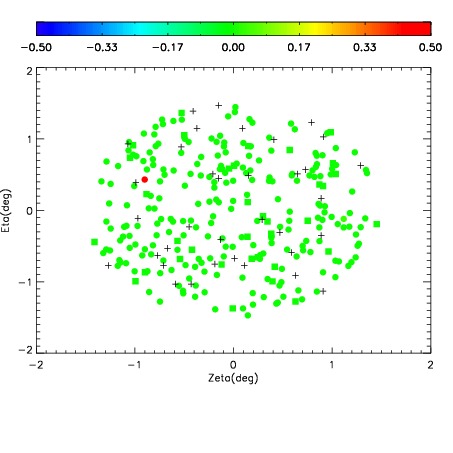
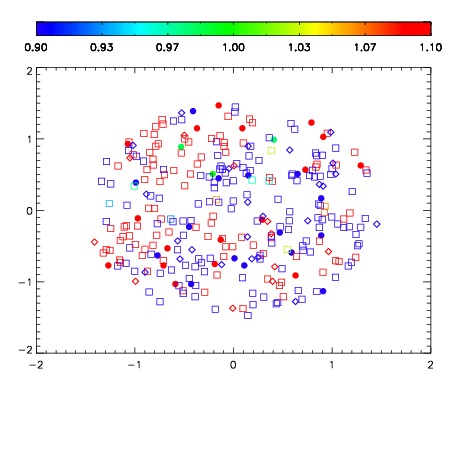
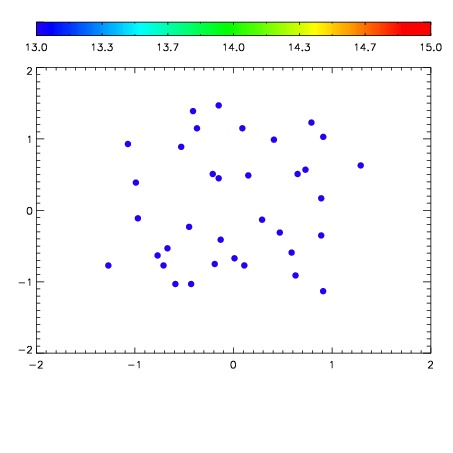

| Frame | Nreads | Zeropoints | Mag plots | Spatial mag deviation | Spatial sky 16325A emission deviations (filled: sky, open: star) | Spatial sky continuum emission | Spatial sky telluric CO2 absorption deviations (filled: H < 10) | |||||||||||||||||||||||
| 0 | 0 |
|
|
|
|
|
|
| IPAIR | NAME | SHIFT | NEWSHIFT | S/N | NAME | SHIFT | NEWSHIFT | S/N |
| 0 | 10630017 | 0.507668 | 0.00000 | 210.104 | 10630011 | 0.00000 | 0.507668 | 208.669 |
| 1 | 10630013 | 0.506685 | 0.000983000 | 218.405 | 10630015 | 0.00353784 | 0.504130 | 216.450 |
| 2 | 10630012 | 0.506422 | 0.00124604 | 215.869 | 10630018 | 0.00463779 | 0.503030 | 214.392 |
| 3 | 10630016 | 0.507470 | 0.000198007 | 212.335 | 10630014 | 0.00288966 | 0.504778 | 213.152 |